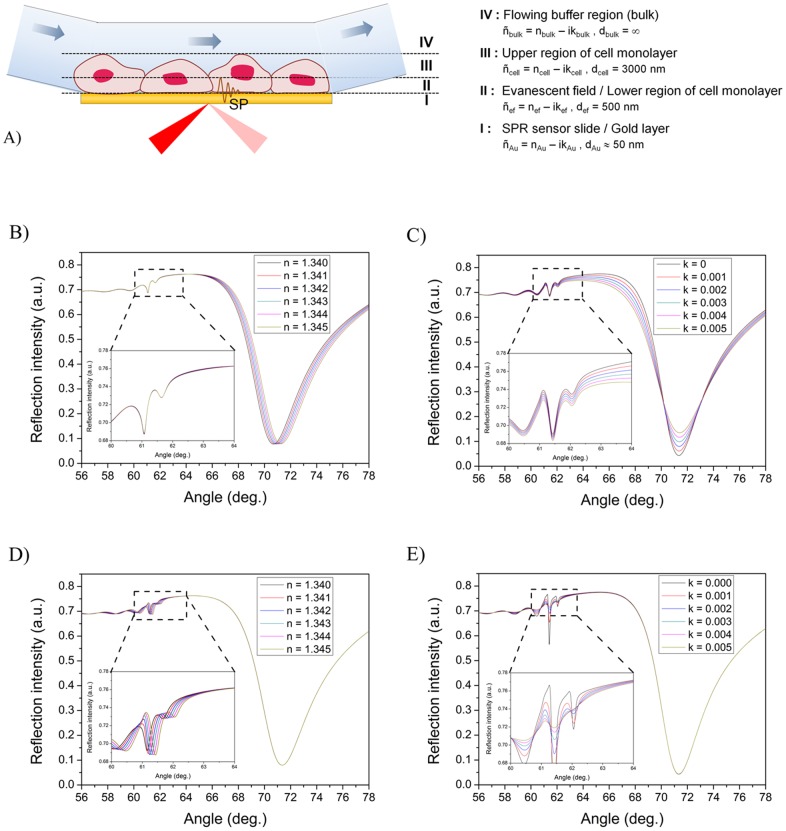
Figure 4. Simulated full SPR spectra for optical changes within different regions of a cell monolayer.
A) Schematic representation of the sample layer used in simulating full SPR angular spectra of cell monolayers. The cell monolayer was theoretically split into three sections in order to clarify the effect of changing different optical properties in it: 1) a thin section in the magnitude of evanescent field close to the sensor surface (ñef, def = 500 nm), 2) a thick section consisting of the rest of the cell (ñcell, dcell = 3000 nm), and 3) an infinite bulk medium layer (ñbulk, dbulk = ∞). Simulated full SPR angular spectra when changing; B) the real (nef) and C) the imaginary (kef) parts of the refractive index for a cell monolayer within the evanescent field, D) the real part of the refractive index (ncell) for a cell monolayer not within the evanescent field and E) the imaginary part of the refractive index (kcell) for a cell monolayer not within the evanescent field. Insets in B-E are more detailed views of the TIR regions. The following parameters were used for simulations: B) dcell = 3000 nm, kcell = 0.002, ncell varied from 1.340–1.345, def = 500 nm, nef = 1.34 and kef = 0.002, C) dcell = 3000 nm with ncell = 1.340, kcell varied from 0–0.005, def = 500 nm, nef = 1.34 and kef = 0.002, D) dcell = 3000 nm, kcell = 0.002, ncell = 1.34, def = 500 nm, kef = 0.002 and nef varied from 1.340–1.345, and E) dcell = 3000 nm, kcell = 0.002, ncell = 1.34, def = 500 nm, nef = 1.34 and kef varied from 0–0.005.

