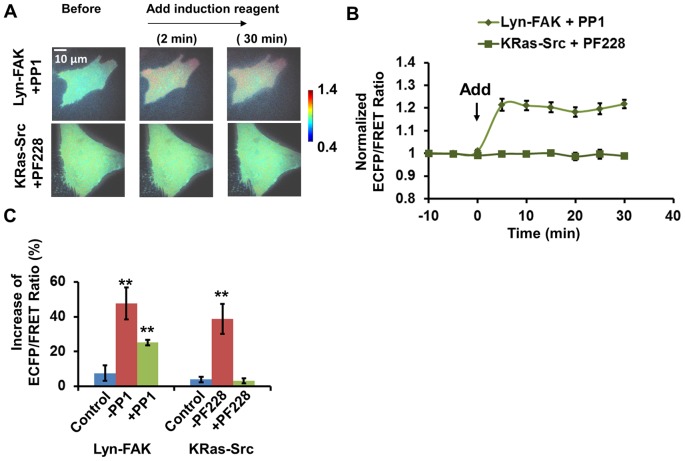
Figure 3. FAK/Src inter-regulation in HMSCs treated with combined osteogenic reagent.
(A) The emission ratio images of the Src and FAK biosensors in HMSCs cross-inhibited by FAK and Src inhibitors with treatment of combined osteogenic reagent, respectively. (B) The time courses of the normalized emission ratio of the Src/FAK biosensor (mean ± SEM) in HMSCs shown in panel (A). (C) The change of the Src/FAK ECFP/FRET ratio (mean ± SEM) in HMSCs shown in panel (A). (**) indicates a group is significantly different from other groups in the same cluster, p-value<0.05 by t-test.

