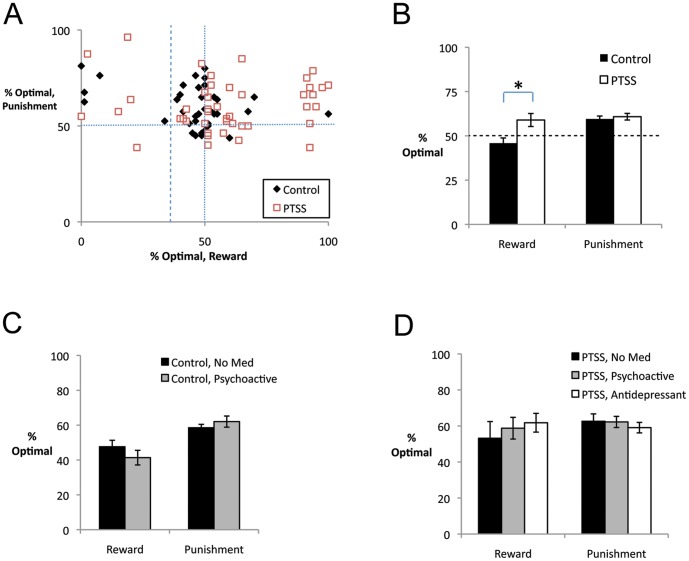
Figure 3. Performance on reward and punishment trials.
(A) There was considerable individual variation in performance on reward trials, and no correlation between performance on reward and punishment trials. Vertical and horizontal lines represent chance performance (50%); note 11 participants who made less than 35% optimal responses on reward trials (dashed line) – i.e. reliably chose the non-optimal response on reward trials. (B) On reward trials, the PTSS group significantly outperformed the control group (F(1,65) = 6.43, p = 0.014) but there was no group difference on punishment trials. (C) There was no significant effect of psychoactive medication status in the control group, which specifically excluded participants self-reporting use of antidepressant medications. (D) In the PTSS group, there were no significant differences among those reporting no medication (“No Med”), antidepressant use (“Antidepressant”), or use of psychoactive drugs excluding antidepressants (“Psychoactive”).

