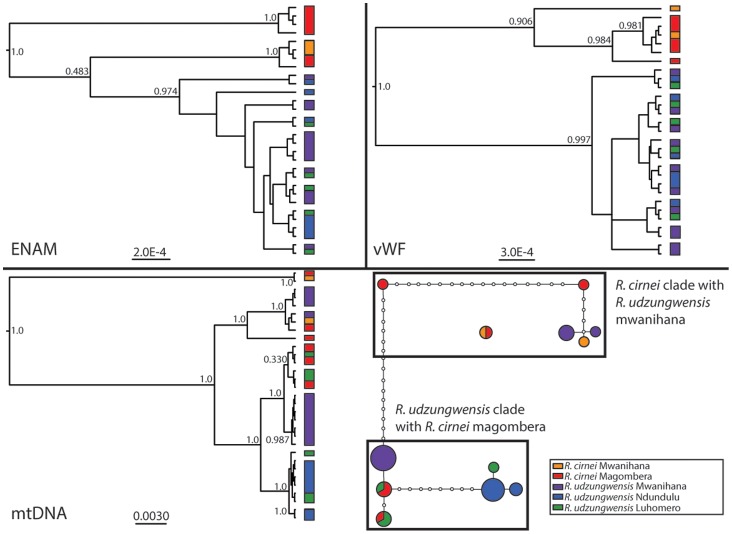
Figure 2. Gene Trees and Haplotype networks.
Bayesian Gene trees of two nuclear loci (top: ENAM and vWF) and concatenated mtDNA (bottom left: ND2, D-loop region, and the ribosomal gene 12S) constructed in MrBayes. Posterior probabilities displayed for major nodes. Branch lengths proportional to genetic distance. (Bottom Right) Haplotype network of concatenated mtDNA. Each node represents one base pair change.

