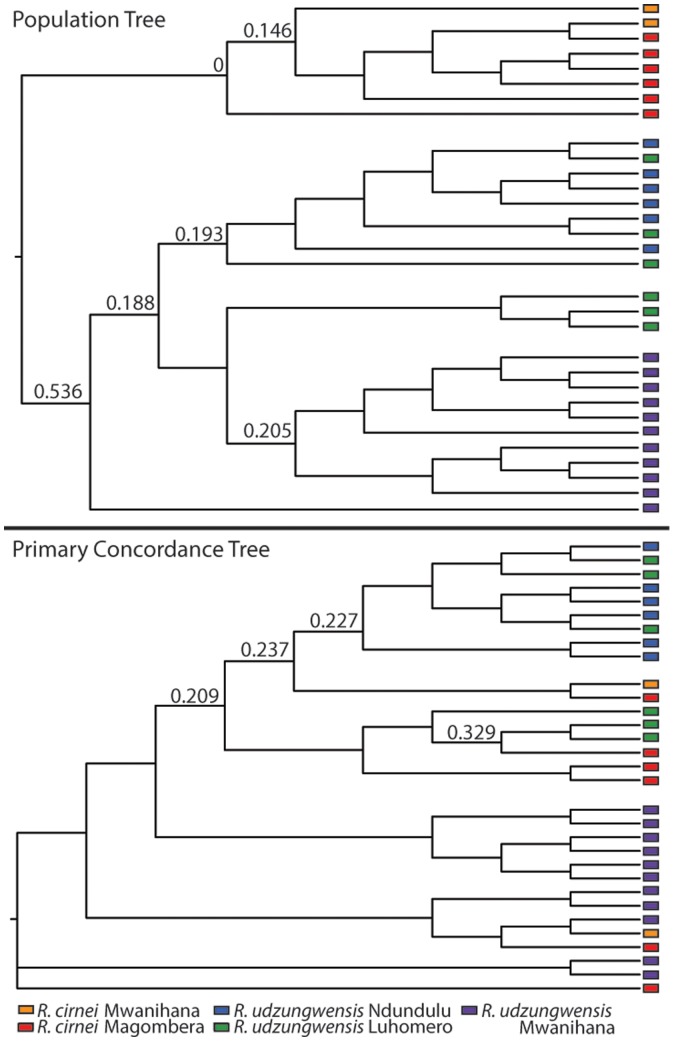
Figure 4. Bayesian concordance analysis in BUCKy: Population Tree (top), Primary concordance tree (bottom).
Posterior mean concordance factors at major nodes are displayed above branches. Branches with concordance factors below 0.2 are not shown except in major nodes. The population tree shows monophyly for the two species, while the primary concordance tree shows admixture between the species and poorly supported relationships implying some level of admixture.

