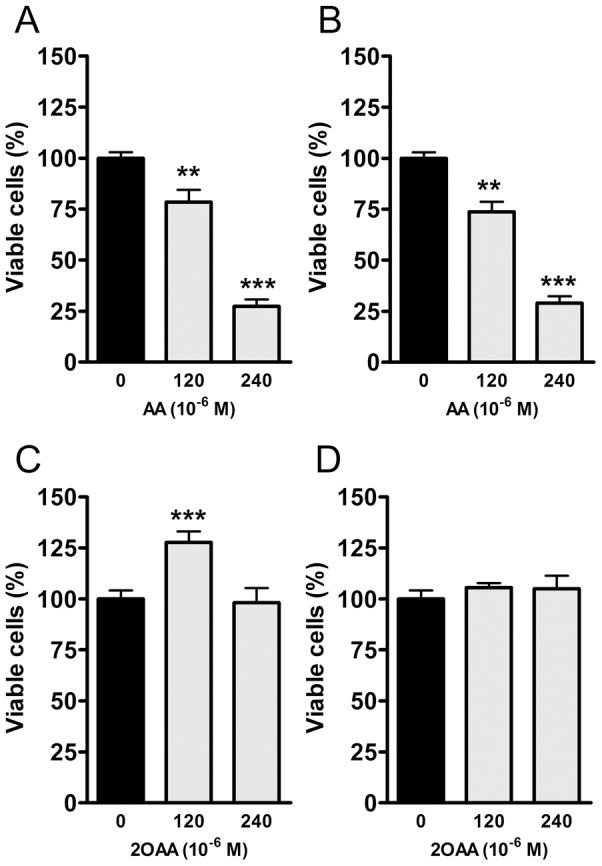
Figure 2. BV2 cell viability is inhibited by AA but not by 2OAA.

BV2 mouse cells were exposed to 120 and 240×10−6 M of AA or 2OAA for 24 h. Upper panel. Bar diagram showing the cell viability assayed with A. MTT or B Trypan Blue by AA (120 and 240×10−6 M) as compared with untreated control cells (100%; n = 6). Lower panel. Bar diagram showing no inhibitory effect on cell viability assayed by C MTT or D Typan Blue by 2OAA (120 and 240×10−6 M) as compared with untreated control cells (100%: ** p<0.01, *** p<0.001; n = 6).
