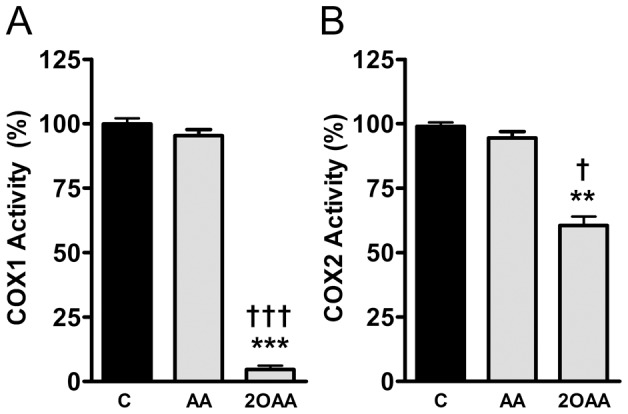
Figure 3. 2OAA inhibits COX1 and COX2 activity.

Bar diagram showing the inhibition of A. COX1 or B. COX2 activity determined by measuring PGH2 production in the presence of 2OAA (250×10−6 M) and AA (250×10−6 M), and compared with untreated control cells (100%: ** p<0.01, *** p<0.001 with respect to controls; † p<0.05, ††† p<0.001 with respect to AA; n = 6).
