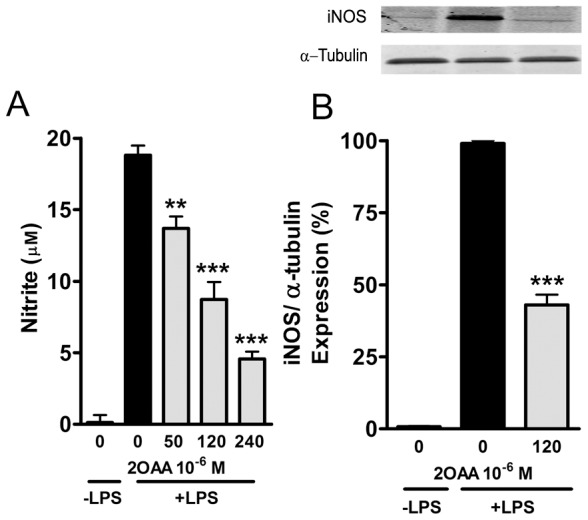
Figure 6. 2OAA attenuates the increase in iNOS protein levels and NO production induced by LPS in BV2 murine microglial cells.

A. Bar diagram showing the dose-dependent effect of 2OAA (50, 120 and 240×10−6 M; 24 h) on NO production (measured by the Griess assay: see Materials and Methods) by BV2 mouse microglial cells previously challenged with LPS (1 µg/ml; 24 h). Results are expressed relative to the NO production in untreated cells in the presence of LPS (100%: ** p<0.005, *** p<0.001; n = 6). B. A representative immunoblot and bar diagram showing the effect of 2OAA (120×10−6 M; 24 h) on iNOS expression in BV2 mouse microglial cells previously challenged with LPS (1 µg/ml; 24 h). Results are expressed relative to the NO produced by untreated cells maintained in the presence of LPS (100%: *** p<0.001; n = 6).
