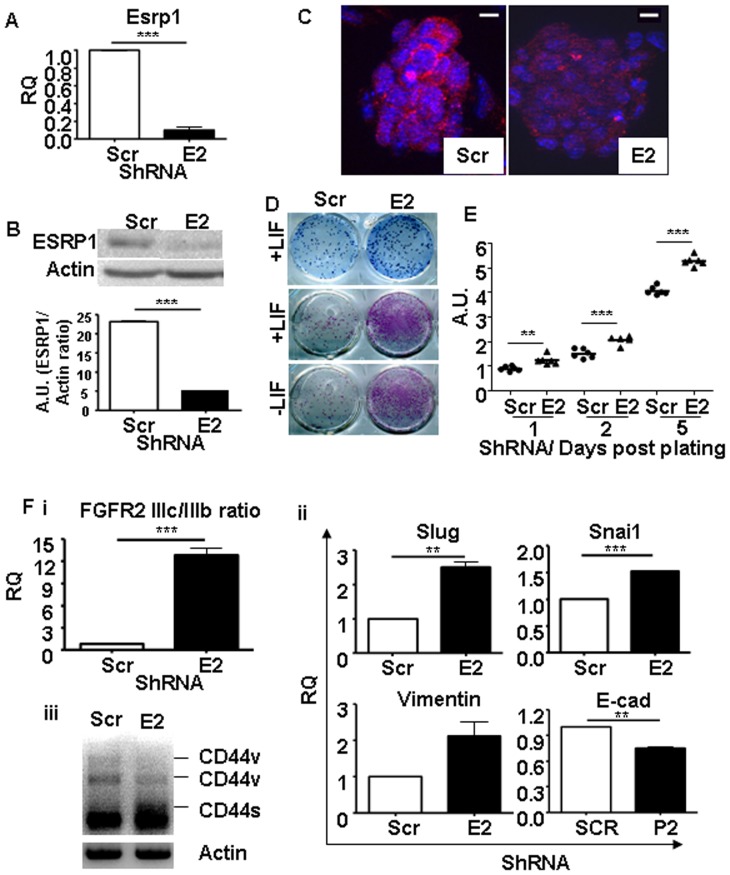
Figure 1. Knockdown of Esrp1 in E14 ES cells using short hairpin RNA.
A. qRT-PCR analysis shows depletion of Esrp1 mRNA in Esrp1-depleted ES cells (E2) w.r.t. Scr controls; RQ is relative quantity (n = 3). B. Western blot analysis of Esrp1 expression in Scr and Esrp1-depleted ES cells. Densitometric analysis of the Western blot is shown; A.U. is arbitrary unit (n = 3). C. Immunofluorescence analysis of ESRP1 in Scr and Esrp1-depleted ES cells. Scale bar is 20 µm. D. Upper panel: Methylene blue staining of Scr and Esrp1-depleted ES cells plated on gelatin. Middle and lower panels: Alkaline phosphatase (ALP) staining of Scr and Esrp1-depleted ES cells in presence and absence of LIF, respectively, showing higher number of pluripotent colonies upon Esrp1 depletion. E. MTT assay perfomed on Scr and Esrp1-depleted ES cells at different time points shows higher proliferation rates of the latter (n = 6). F. qRT-PCR analysis shows an increase in (i) FGFR2 IIIc/IIIb ratio and (ii) Slug, Snai1 and Vimentin in Esrp1-depleted ES cells compared to Scr controls (n = 4). A slight decrease in E-cadherin (E-cad) was also observed. (iii) CD44 was amplified by PCR and shows a shift from variable isoform (CD44v) to standard isoform (CD44s) upon ESRP1 depletion indicating acquisition of a “mesenchymal” phenotype.

