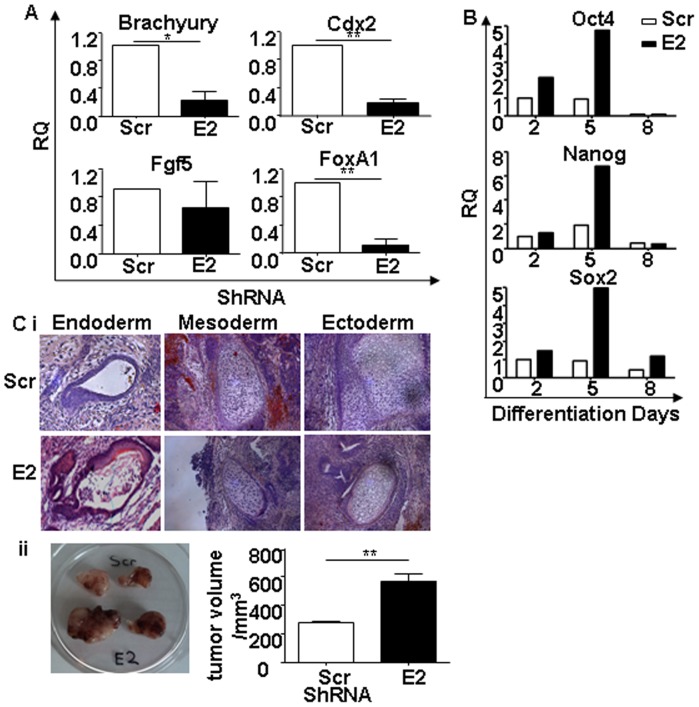
Figure 4. Analysis of differentiative potential of Esrp1-depleted ES cells.
A. qRT-PCR analysis of Brachyury (mesoderm), Cdx2 (trophectoderm), Fgf5 (ectoderm) and FoxA1 (endoderm) mRNA in Scr and Esrp1-depleted embryoid bodies (EB) five days after the differentiation process. RQ is relative quantity (n = 4). B. Representative qRT-PCR analysis of Oct4, Nanog and Sox2 mRNA in Scr and Esrp1-depleted EBs at different time points. C i. Teratoma formation 4 weeks after subcutaneous injection of 350 000 Scr or Esrp1-depleted ES cells in NSG mice. Hematoxylin/eosin staining demonstrates the presence of all three germ layers (n = 8). ii. Teratomas generated at 19 days after subcutaneous injection of 50 000 Scr and Esrp1-depleted ES cells in NSG mice. Graph shows tumor volume measured with a calliper (n = 3).

