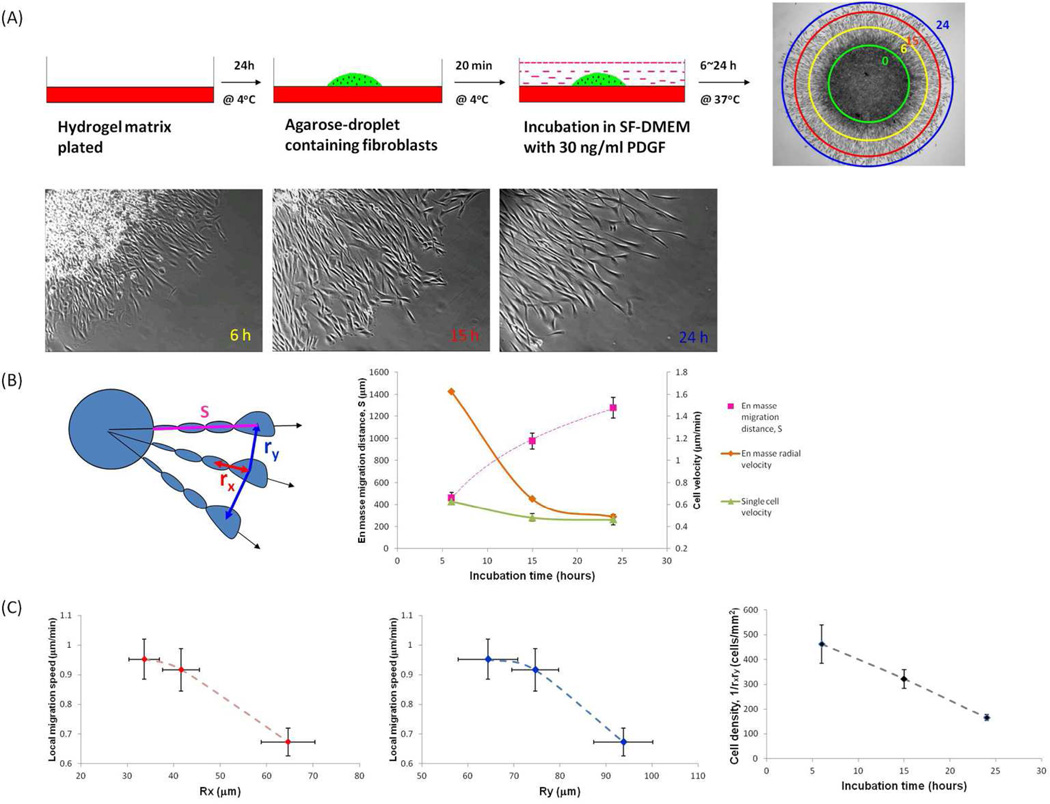
Figure 1.
En masse cell migration decreased as cell density decreased. (A) Schematic of agarose droplet assay; low-magnification phase image obtained after 24h and rings indicating distance of migration at 0, 6, 15 and 24h; and high-magnification phase image of cell migration from agarose droplet at 6, 15 and 24h. (B) Schematic defines migration distance from edge of original droplet to nucleus of a given cell at migration front as S, and distance between nuclei of cells along the radial direction as rx, or along the circumference as ry. Graph shows average migration distance (S) as function of incubation time, together with derivative of curve, which is radial velocity function, compared to single cell migration velocity measured after the same incubation time. (C) Local migration speed of cells at the migration front as function of rx and ry, and local cell density (1/rxry) as function of incubation time. (B. en masse migration distance, mean±SD; single cell migration velocity, mean±SE, n=26–30; C mean±SE, n=12–18)

