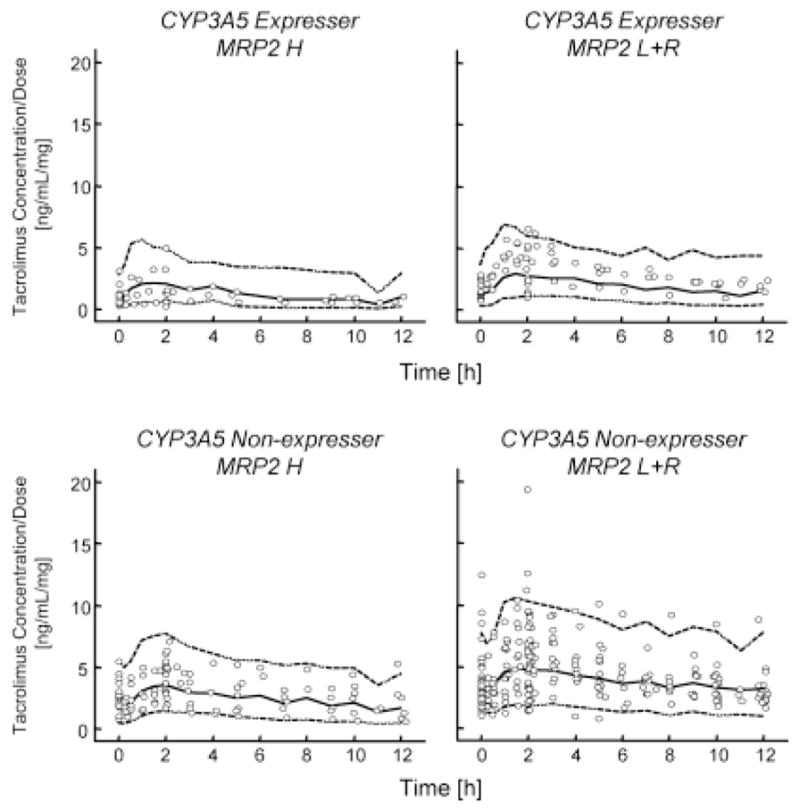
Fig. 3. The visual predictive check for dose-normalized tacrolimus concentrations.

Comparison of observed dose-normalized tacrolimus concentrations with the 97.5th (upper dashed line), 50th (middle solid line) and 2.5th (lower dashed line) percentiles of the 1000 simulated datasets.
