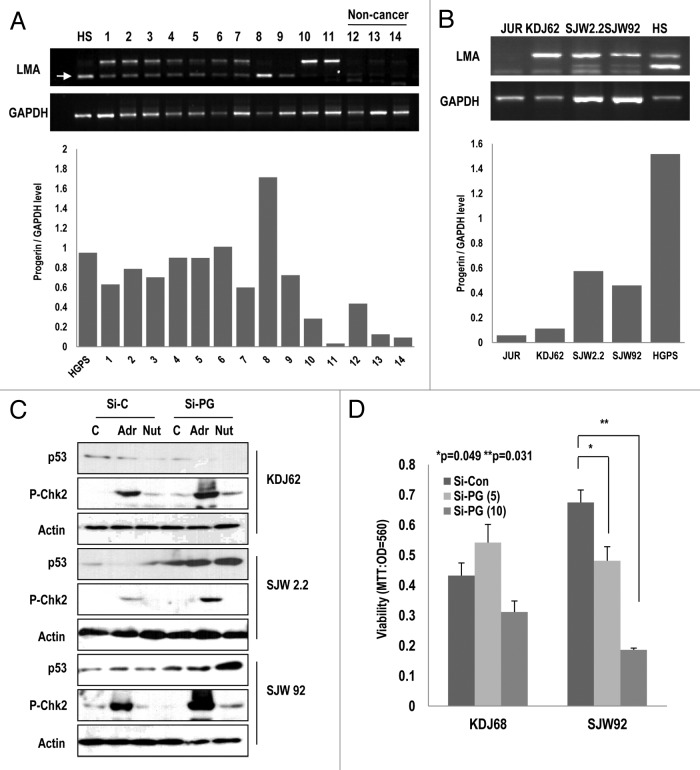
Figure 6. Elevated expression of progerin in human leukemia samples. (A) A large portion of leukemia samples express progerin. Using RT-PCR, we explored the expression of progerin and found that among 11 leukemia samples (1–11), 9 samples expressed progerin (arrow). In contrast, normal samples did not show progerin expression (12–14). HGPS (HS) cells were used as a positive control of progerin. Among them, 5 samples (#1, 3, 5, 7, and 8) exhibited a smaller band that was confirmed to correspond to progerin using the cloning and sequencing method. The relative expression of progerin/GAPDH was provided as a graph (below). (B) Progerin expression in 3 established cell lines. Using the patient’s white blood cells, 3 types of cell lines were established (KDJ62 from #11, SJW2.2 from #8, and SJW92 from #2). Among them, two cell lines (SJW2.2 and SJW92) expressed progerin. Jurkat (JUR) and HGPS (HS) were used for control cell lines. The relative expression of progerin/GAPDH was provided as a graph (below). (C) Si-progerin (Si-PG) enhances p53 expression and the DNA damage response. In progerin-positive cell lines (SJW2.2 and SJW92), si-PG enhanced the responsibility of p53 and p-Chk2 to adriamycin (Adr) and Nutlin-3 (Nut). In contrast, KDJ62 did not show a significant difference. (D) Si-progerin (Si-PG) suppressed the cell viability in a progerin-dependent manner. Si-PG suppressed the cell viability in SJW92 cell lines. In contrast, KDJ62 did not show a reduction of viability. Cells were transfected with 5 or 10 μg/ml of si-progerin for 24 h.

An official website of the United States government
Here's how you know
Official websites use .gov
A
.gov website belongs to an official
government organization in the United States.
Secure .gov websites use HTTPS
A lock (
) or https:// means you've safely
connected to the .gov website. Share sensitive
information only on official, secure websites.
