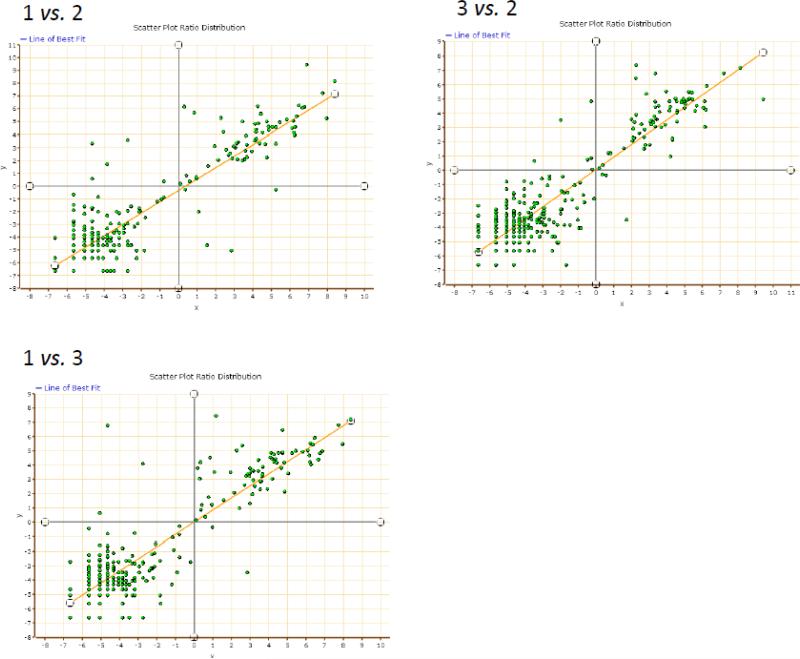
Figure 3. Regression plots of ratios measured across triplicate serum samples spiked each with the same amounts of stable isotope labeled U87 + T98 secretome.
Three aliquots from the same serum sample containing 100 μg of total proteins each were spiked with 50 μg SILAC labeled proteins collected from U87 and T98 condition media. Each plot represents a log regression plot of ratios between two separate experiments.

