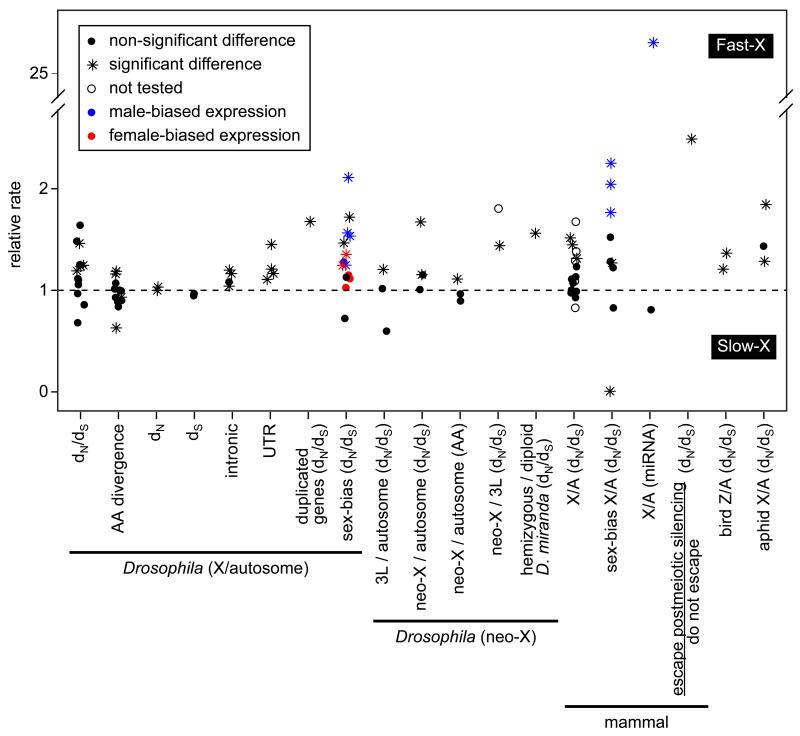
Figure 2. Tests for faster-X divergence.
The relative rate of evolution is plotted for different classes of nucleotide sites and chromosomes in Drosophila [29-31, 33, 35-37, 39], mammals [12, 18, 40, 42, 60, 62, 64, 65], birds [48], and aphids [49]. The rate of evolution is measured as either dN/dS, amino acid (AA) divergence, or nucleotide divergence at different classes of cites (indicated on the x-axis). Relative rates are either X/autosome, D. melanogaster chromosome arm 3L (homolog of the D. pseudoobscura neo-X)/autosome, D. pseudoobscura neo-X/autosome, D. pseudoobscura neo-X/D. melanogaster 3L, hemizygous/diploid genes on the D. miranda neo-X, or mammalian genes that escape postmeiotic silencing/those that do not escape. The expectation if X-linked and autosomal genes evolve at equal rates is represented by the dashed line. Significant deviation from unity in the relative rate is indicated by an asterisk, whereas non-significant differences or studies in which significance was not reported are indicated by a circle. In experiments where expression was measured (indicated by “sex-bias” in the x-axis label), the color of the point indicates the expression class of the genes (black=non-sex-biased, blue=male-biased, red=female-biased).

