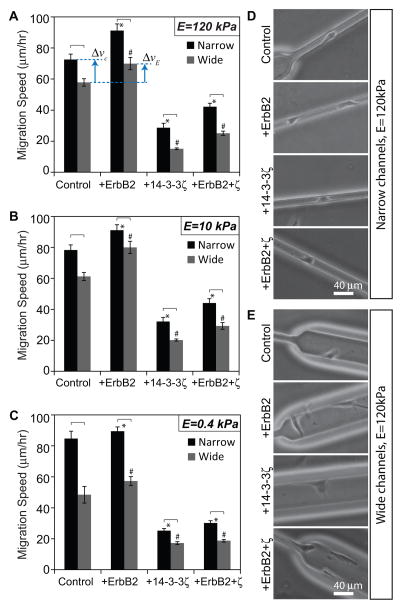
Figure 2. Migration speed across oncogenic lesions, channel confinements and ECM stiffness.
Mean migration speed of MCF10A cells of varying transforming potentials (control, +ErbB2, +14-3-3ζ, and +ErbB2+ζ) inside narrow and wide channels made of PA of stiffness (A) 120 kPa, (B) 10 kPa, and (C) 0.4 kPa. Phase contrast images of cells of varying transforming potentials inside (D) narrow and (E) wide channels made of stiff (120 kPa) PA. *p<0.05 with respect to control in narrow channels. #p<0.05 with respect to control in wide channels. Statistically different pairs (p<0.05) are indicated by horizontal square brackets. n>30 cells per condition. Scale bar = 40 μm.

