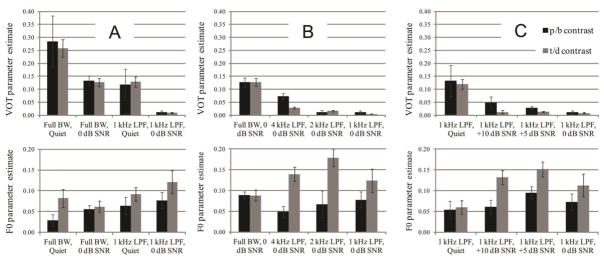
Figure 6.

Parameter estimates (coefficients) for the logistic models for the three comparisons: A) Initial exploration of LPF and noise effects; B) Effects of LPF with 0 dB SNR; (C: effects of SNR with 1 kHz low-pass filter. Greater bar height indicates greater influence of the cue in the model. Black and gray bars represent estimates for the /b/-/p/ and /d/-/t/ contrasts, respectively. The upper and lower panels illustrate estimates for the VOT and F0 cues, respectively. Error bars reflect ± 1 standard error of the mean of the coefficients across participants.
