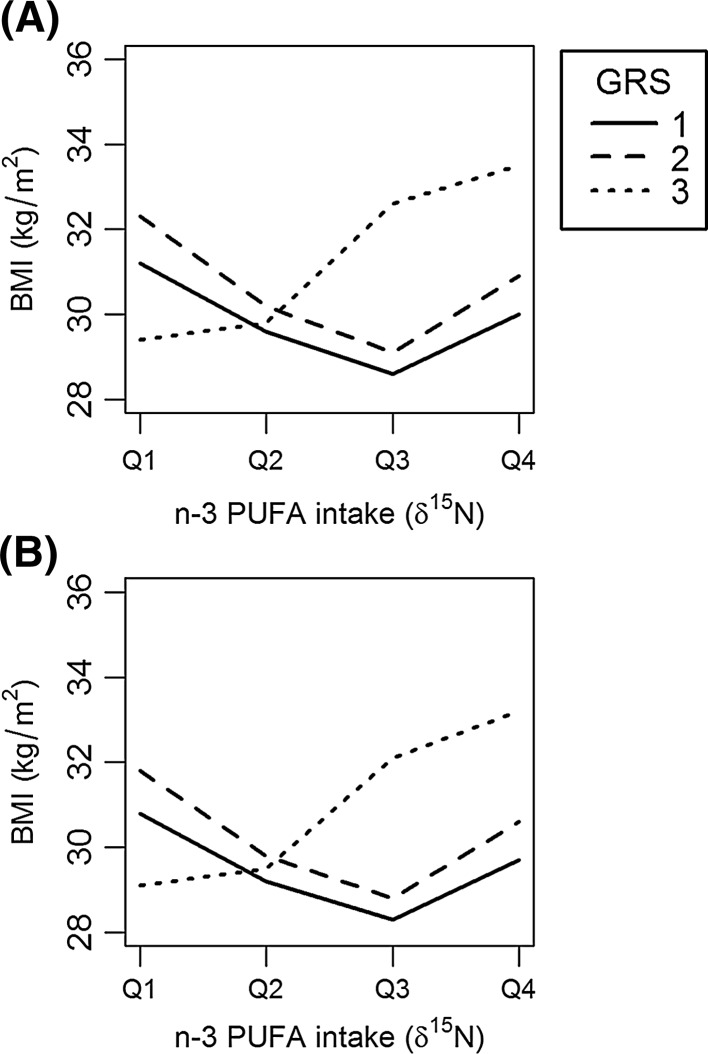
Fig. 3.
n-3 PUFA intake modifies the GRS association with BMI after correction for either a total fat intake (p = 0.034) or b total energy intake (p = 0.033). In a subset of participants (n = 488), we evaluated whether total fat intake (kcal) or total energy intake (% calories) confounded the GRS*n-3 PUFA intake interaction with BMI by including these variables, derived from 24 Hour Recalls (24HR), as an additional covariate in the δ15N*GRS interaction model. n-3 PUFA intake (δ15N) is represented as a categorical variable with four groups by quartile (Q1–Q4) where Q1 is lowest level of n-3 PUFA intake and Q4 is the highest level of n-3 PUFA intake. The GRS is represented as a categorical variable with three groups by tertiles (T1–T3) where T1 is lowest obesity GRS and T3 is highest obesity GRS

