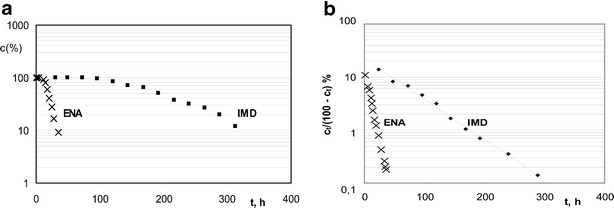
Fig. 3.

Diagram demonstrating a changes in concentration of IMD and ENA during exposition to humid atmosphere RH ∼76.4% at 90°C and b semilogarithmic plots c t / (c 0 − c t) = f(t) for the degradation of IMD and ENA in solid state at RH ∼76.4% and T = 90°C
