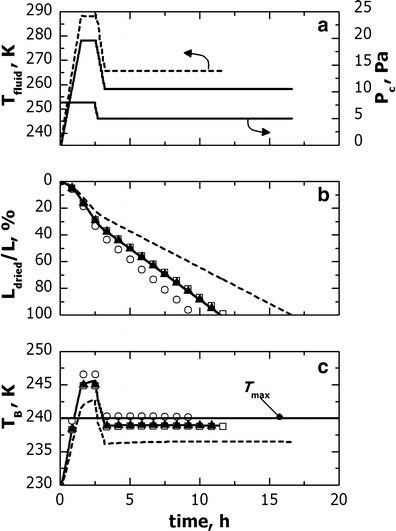
Fig. 11.

Comparison between the freeze-drying cycles developed in freeze-dryer A (solid line) and scaled-up in freeze-dryer B (dashed line). In the cycle scale-up, vial 1 for freeze-dryer A and 1b for freeze-dryer B were used as reference vials. The evolution of (graph b) L dried and (graph c) T B for vial 1 (solid line, 1a: open circle, 1b: filled upright triangle) and 3 (dotted line, open square) is also shown for both (lines) the original cycle and (symbols) the cycle scaled-up in freeze-dryer B
