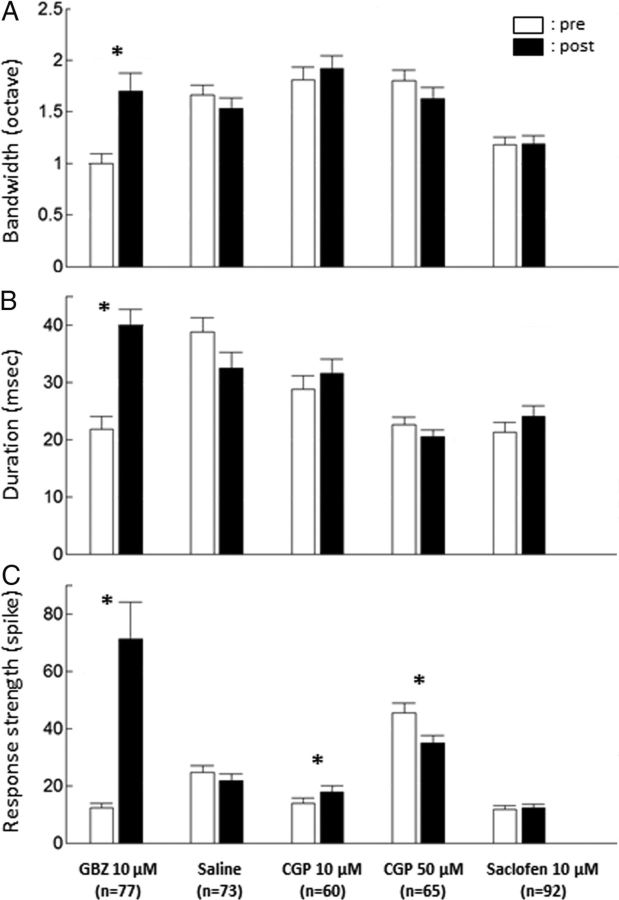
Figure 4.
Group data showing the effects of the pharmacological agents on three STRF parameters. The bandwidth (A) corresponds to the sum of the width (in octaves) for all significant STRF peaks. The duration (B) is the difference between the last and first spikes within a significant STRF peak in milliseconds. The response strength (C) is the number of spikes within significant STRF peaks. Note that only GBZ produced a significant increase of these three parameters. Bars represent mean values; error bars represent SE. Black bars, Before application; white bars, immediately after application. *p < 0.0033, significant paired t test (Bonferroni's correction, 15 tests).

