Figure 5.
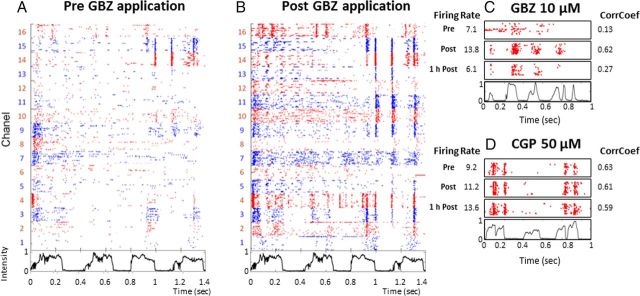
Rasters illustrating the effects of GABAA or GABAB antagonist application on responses to vocalizations. Neuronal responses were recorded under 16 electrodes before GBZ application (A) and after application (B). Each dot represents the emission of an action potential under the electrode labeled on the left. Each line corresponds to the neuronal response to a chutter call, the envelope of which is represented below the raster plot. Each vocalization is presented 20 times, and the raster plots are aligned on the beginning of the stimulus. This representation allows the detection of reproducible spike patterns within cortical responses. To facilitate visualization, the raster color is changed from one electrode to the next. Here, GBZ application increased the responses by reinforcing the preexisting temporal spikes patterns (electrodes 14 and 15) and promoting the emergence of patterns under non-responsive electrodes (electrodes 9 and 11–13). C, Quantification of the effects induced by GBZ application: for this recording, the raster plots represent responses before GBZ application (Pre), immediately after application, (Post) or 1 h after application (1 h Post). Values of evoked firing rate and temporal reliability coefficient (CorrCoef) are given alongside the figure. Note the simultaneous increase in firing rate and in CorrCoef post-GBZ application. The values returned to control level 1 h after application. D, Quantification of the effects induced by a 50 μm CGP application. Conventions as in C. Note the lack of effect on the firing rate and CorrCoef.

