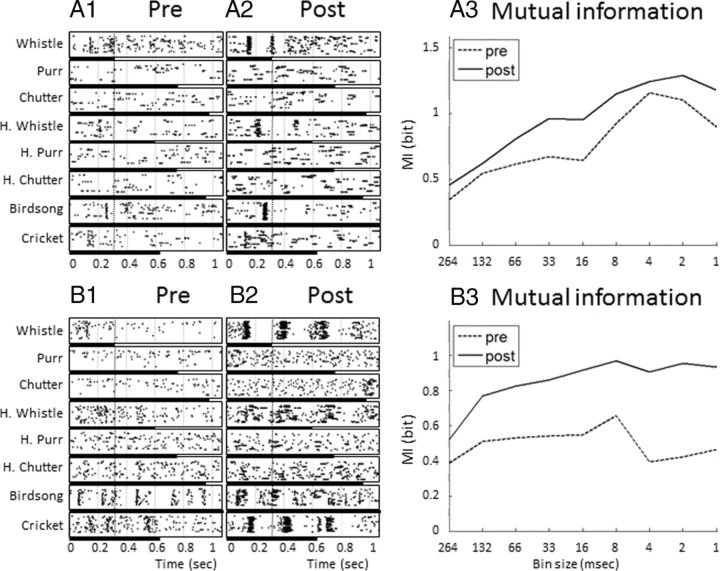
Figure 9.
Rasters of neuronal responses to the whole set of eight vocalizations and values of MI calculated from these responses with different temporal resolutions. The responses to the eight vocalizations for two different recording sites are represented before (A1, B1) and after (A2, B2) GBZ application. The dotted vertical line represents the duration of the shortest vocalization (Whistle, 264 ms), which was used to compute the MI. The black bars below the raster plots represents the duration of each vocalization. The MI values were computed from these responses before (A3–B3, dotted lines) and after (A3–B3, filled lines) GBZ application using different bin sizes. MI calculated from the largest bin size (264 ms) corresponds to MI carried by the firing rate (MIFR). MI values obtained with smaller bin sizes correspond to the MI carried by progressively more precise temporal patterns. On average (but not systematically), the highest values of MI were obtained for a 8 ms bin size. Note that GBZ application increased the MI values regardless of the bin size.

