
Table 3.
Mineral contents of dried mushrooms (mg/100 g)
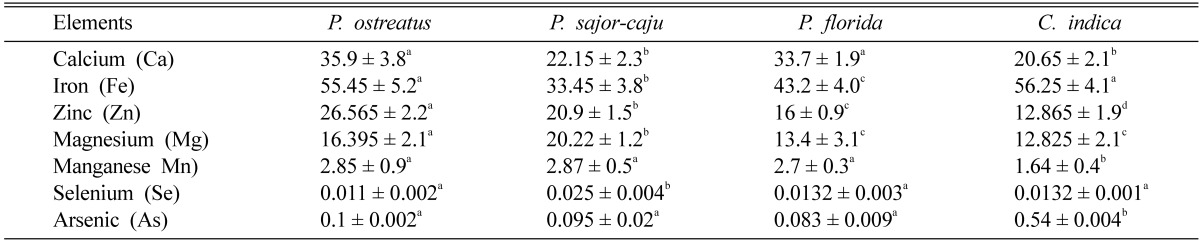
Results show mean ± SEM of 3 trials. Values in the same row that do not share a common superscript are significantly different at P < 0.05 (one way ANOVA then LSD post hoc comparison).
Official websites use .gov
A
.gov website belongs to an official
government organization in the United States.
Secure .gov websites use HTTPS
A lock (
) or https:// means you've safely
connected to the .gov website. Share sensitive
information only on official, secure websites.
Mineral contents of dried mushrooms (mg/100 g)
Results show mean ± SEM of 3 trials. Values in the same row that do not share a common superscript are significantly different at P < 0.05 (one way ANOVA then LSD post hoc comparison).