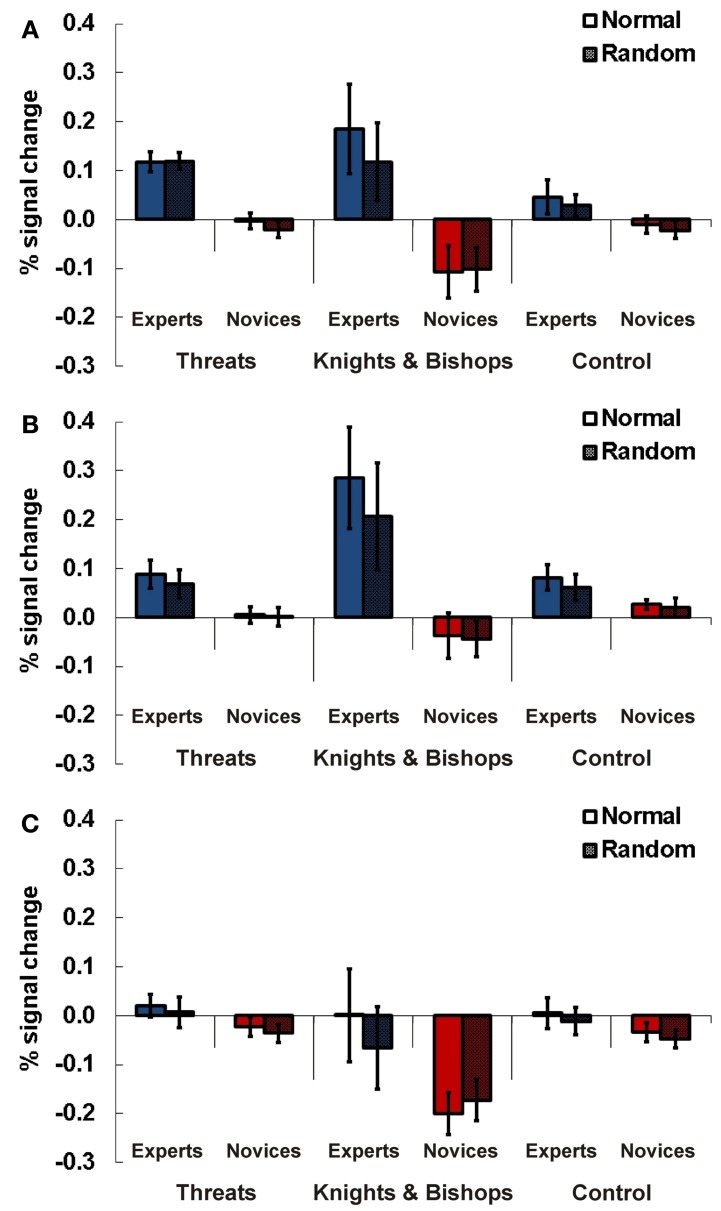
Figure 6.
Results Experiment 4. Percent signal change (PSC) for the three experimental conditions threats (indicated whether the number of threats of black to white was four), knights and bishops (indicate whether the number of knights and bishops of both colors was four), and control (non-chess control task, all pieces regardless of color or type were counted, indicate if the number is 15) for experts and novices in normal (chess pieces arranged according to real chess matches) and random (chess pieces in randomized distribution) chess arrays. Results are presented for TPJ ROI right (A), left anterior (B), and left posterior TPJ (C). Error bars indicate standard error of the mean.

