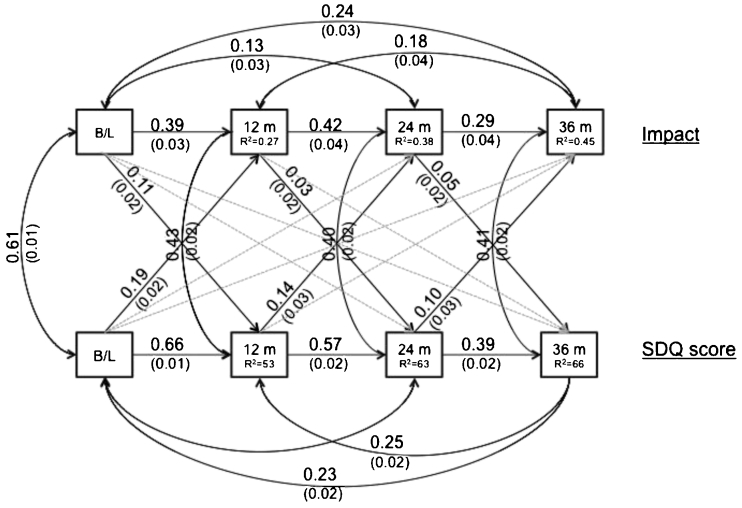
Fig. 2.
Path analysis of the relationship between impact and SDQ total symptom score across time (all parent reported). Significant (p < 0.05) paths or correlations with standard errors in brackets are presented as solid straight lines or solid curved arrows respectively, dashed lines illustrate non significant associations. B/L = baseline, R 2 = proportion of variance explained

