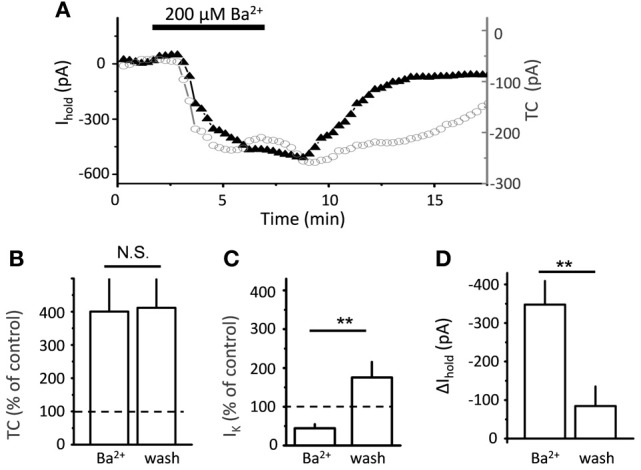
Figure 2.

Time-course of Ba2+ effect on transporter current and K+ current. (A) Bath-applied 200 μ M BaCl2 produces downward shift in Ihold (black triangles), and increase in transporter current (TC, empty circles) in a single cell. (B) Summary graph of mean normalized transporter current (TC, n = 5) in the presence of Ba2+ and after 5 min of washout (wash). (C) Summary graph of normalized K+ current (n = 5) in the presence of Ba2+ and after 10 min of washout (wash) (D) Summary graph of mean Δ Ihold (n = 5) in the presence of Ba2+ and after 10 min of washout (wash). Error bars—SEM; **P < 0.01; N.S.—non significant; One-Way ANOVA post-hoc Tukey test.
