
Figure 3.
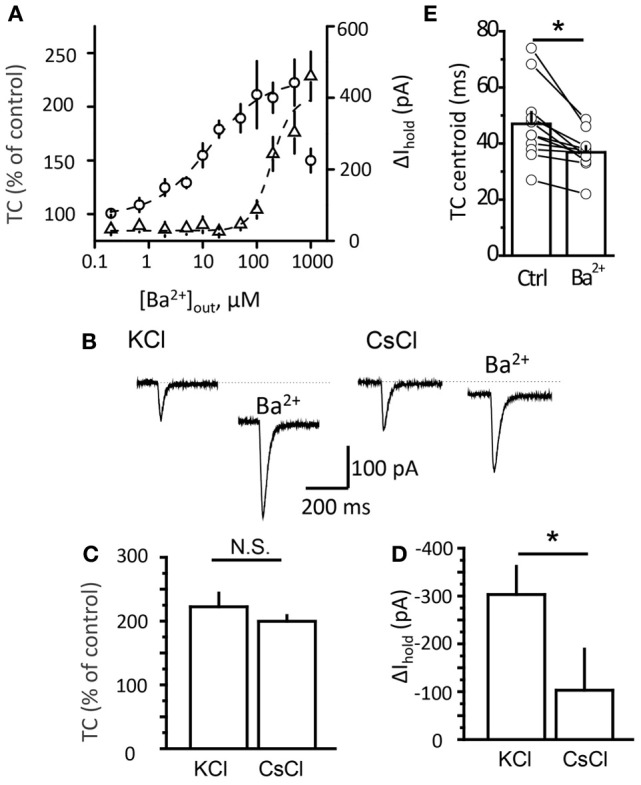
Potentiation of transporter current is independent of Kir blockade. (A) Dose-response curve of TC (circles) and Δ Ihold (triangles) changes. (B) Transporter current (TC) elicited by local glutamate uncaging in control and in 200 μM Ba2+. The downward shift in the holding current was less pronounced in Cs+-loaded cells (CsCl). The TC amplitude increased to a similar degree in both cases. (C,D) Mean Ba2+ effect on transporter current (TC, B) and Ihold (Δ Ihold, C) for CsCl- and KCl-based intracellular solutions. (E) Transporter current centroids in control and in 20 μM Ba2+. Error bars—SEM. *P < 0.05; N.S.—non significant; paired (E) and unpaired (C,D) t-test.