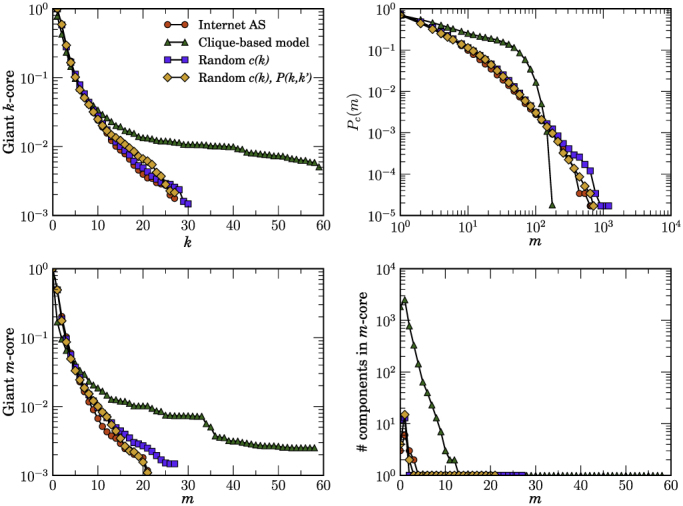
Figure 2. Measuring hierarchies in real and random networks.

Comparison of the k-core and m-core decompositions between the real Internet AS network, the clique based model, and maximally random models. “Random c(k)” stands for the maximally random model with a fixed degree distribution and clustering spectrum c(k). “Random c(k), P(k, k′)” stands for the maximally random model that preserves also the degree-degree correlation structure of the real network. The top left plot shows the relative size of the giant k-core as a function of k. Top right plot shows the complementary cumulative distribution of edge multiplicities. Bottom left plot shows the relative size of the giant m-core as a function of m. Finally, the bottom right plot shows the number of components in the m-core as a function of m.
