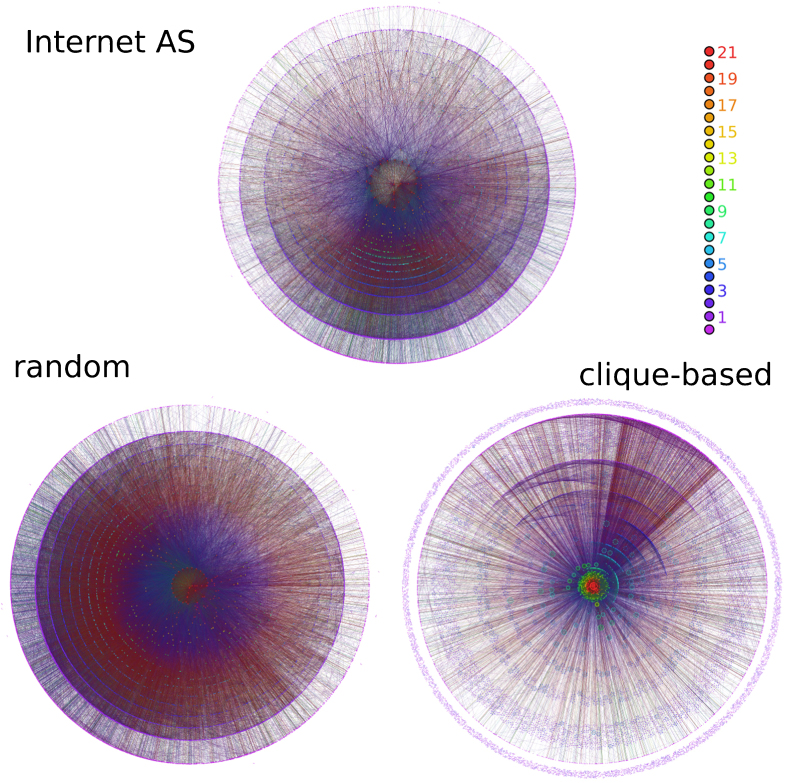
Figure 5. Visualizing m-cores.
m-core decomposition of the Internet AS network and its random versions. The MR version shown on the bottom left plot of the figure corresponds to the “Random c(k)” model, that is, with the rewiring scheme that does not preserves degree-degree correlations. The latter case is always closer to the real network. The color code is determined by the real network and kept the same in its random versions. However, layers in random networks above the maximum m-coreness of the real network are colored all in red. Maximum m-coreness for the MR and CB models are 27 and 58, respectively.

