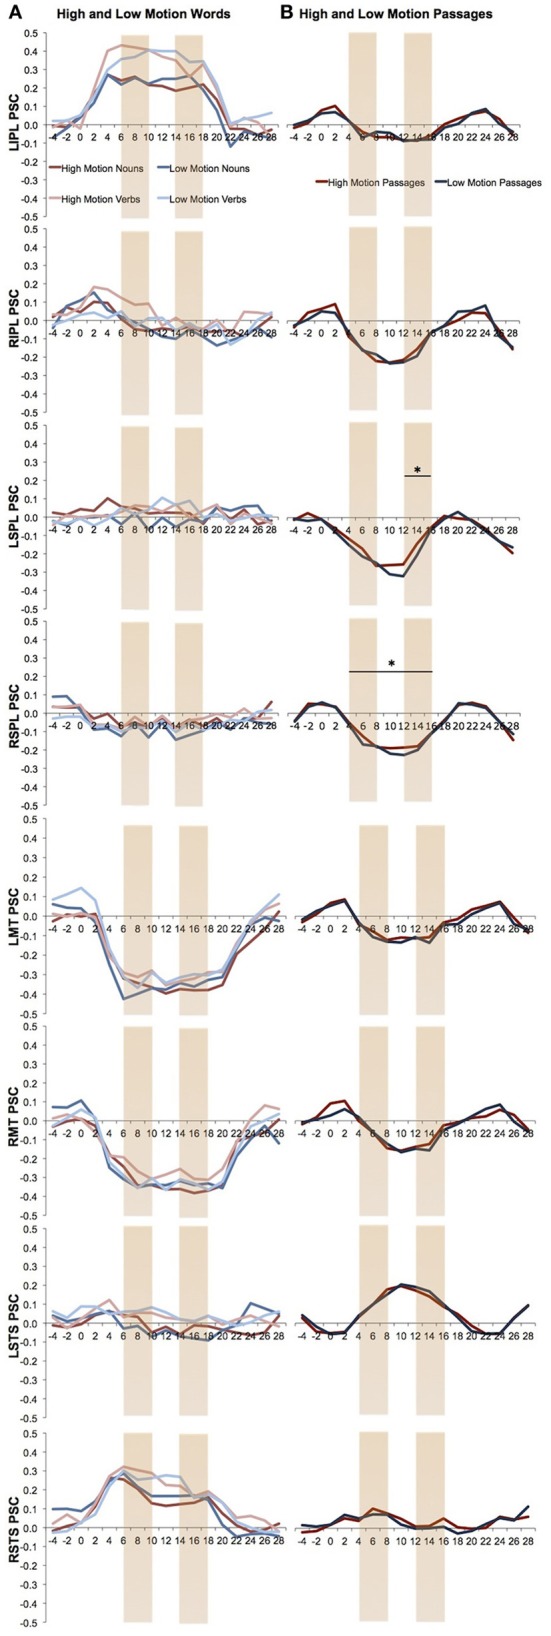
Figure 3.

Percent signal change over the time in the visual motion ROIs. The first and last two TRs are marked. (A) Percent signal change of the high and low motion nouns and verbs. Analyses were averaged from TR 6 to18. (B) Percent signal change of the high and low motion passages. Analyses were averaged from TR 4 to16. Asterisks indicate a significant difference between the high and low motion conditions (P < 0.05).
