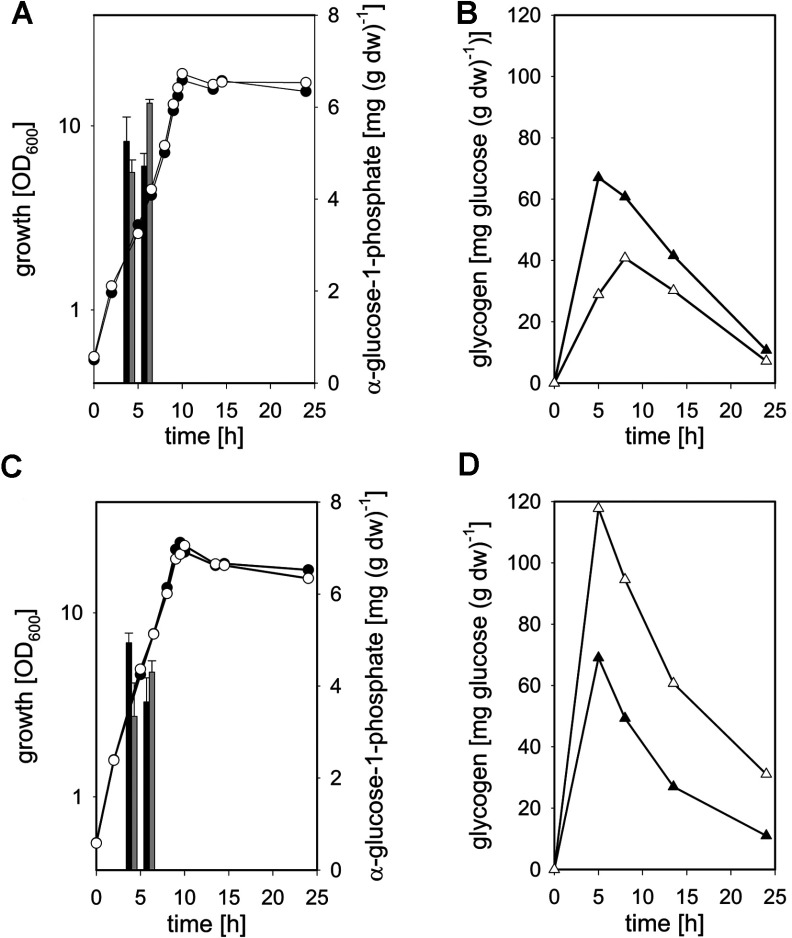
Figure 4. Growth (circles), intracellular glc-1-P levels (bars) and glycogen content (triangles) of C. glutamicum WT (filled symbols, black bars) and C. glutamicum IMpgm (open symbols, grey bars) in the course of cultivation in minimal medium with 1% (w/v) glucose [(A) growth and glc-1-P levels, (B) glycogen content] or 1% (w/v) maltose [(C) growth and glc-1-P levels, (D) glycogen content] as sole carbon sources.
Glycogen was determined enzymatically as glucose liberated after amyloglucosidase treatment (two determinations per sample). Three independent cultivations were performed; the S.D.s of the glycogen contents were<10%.

