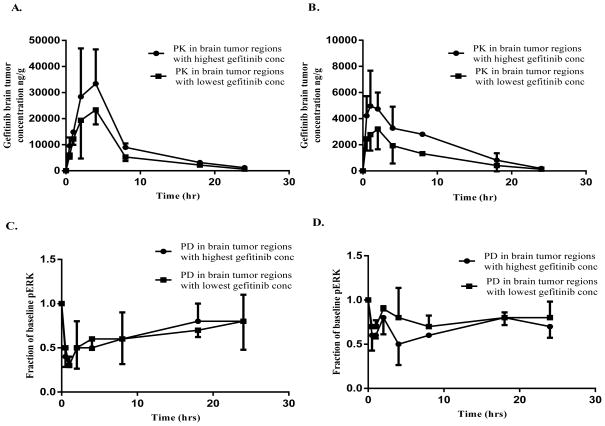
Figure 2.
Intratumoral variability in gefitinib PK/PD following single oral doses of 150 mg/kg and 50 mg/kg gefitinib to mice bearing intracerebral U87/vIII tumors. A. Gefitinib brain tumor concentrations at 150 mg/kg and B. 50 mg/kg and C. PD responses based on pERK (fraction of baseline pERK) at 150 mg/kg and D. 50 mg/kg, in the regions with the lowest and highest variability. All observed points represent the mean + or − SD.

