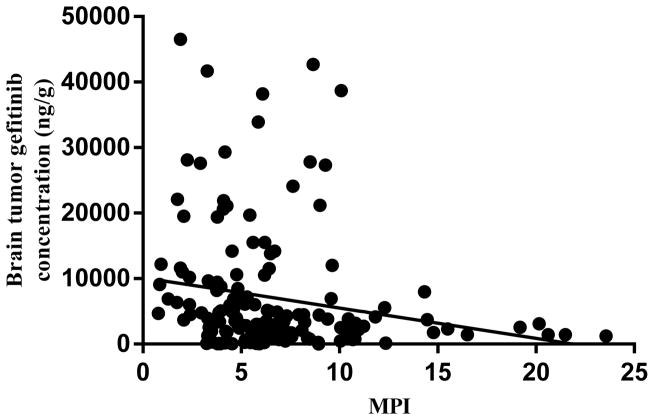
Figure 4.
Regional gefitinib brain tumor concentrations as a function of the corresponding regional MPI (as determined by immunohistochemical analysis) values following single doses of 50 mg/kg and 150 mg/kg gefitinib orally (all mice and regions included). A significant negative correlation was found, Pearson correlation coefficient = −0.19, P= 0.014.

