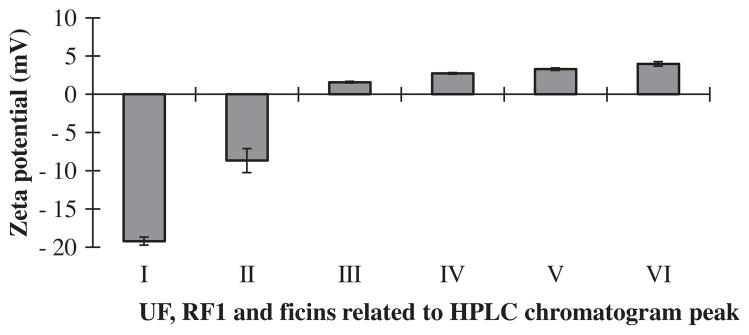
Fig. 4.

These bar graphs show the results of Zeta potential measurements for UF, RF1 and ficins related to HPLC chromatogram peaks in order of their elution time from cation-exchange column. UF related to peak (I) is before and the rest are after salt gradient elution.
