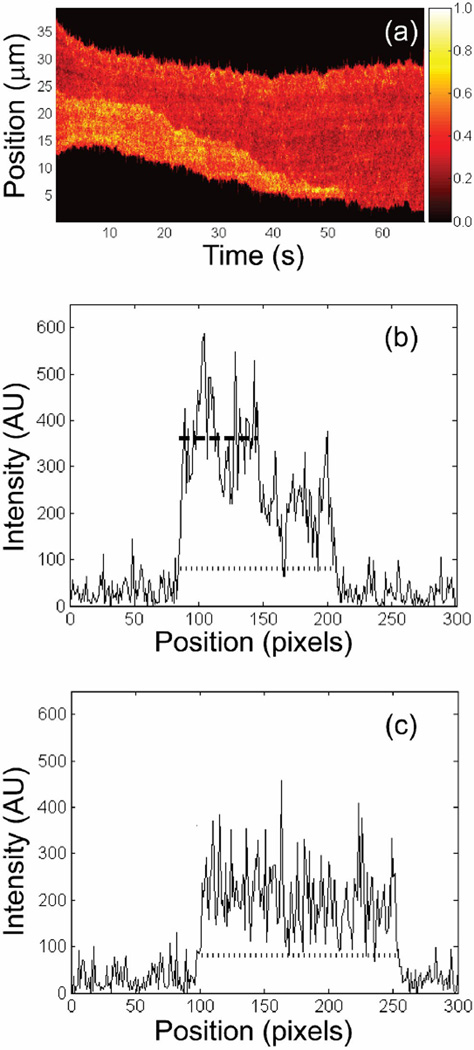
Figure 4.
(a) Time trace showing normalized fluorescent intensity projected transverse to the nanochannel axis as a function of time. (b) Projected intensity of the DNA molecule shown in (a) as a function of position along the nanochannel while folded at 15 s. Both the end-to-end (dotted line) and folded length (dashed line) were determined using the algorithms described in the text. The intensity in the folded region is approximately twice as large as in the unfolded region. (c) Intensity projection of the same molecule at 55 s. At this point the molecule is completely unfolded resulting in a roughly constant projected intensity.

