
Figure 1.
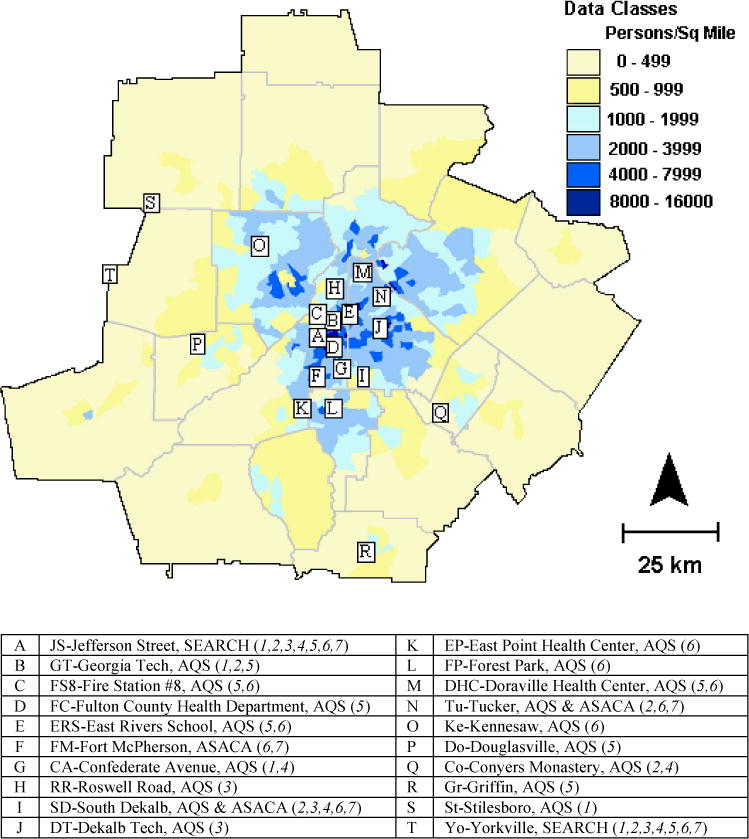
Map of twenty-county metropolitan Atlanta area with population density from 2000 census data. Letters reference monitor locations; the table identifies station name, network, and air pollutants monitored: 1=SO2; 2=NO2/NOx; 3=CO; 4=O3; 5=PM10 mass; 6=PM2.5 mass; 7=PM2.5 composition (EC, OC, NO3−, SO42−).