
Figure 5.
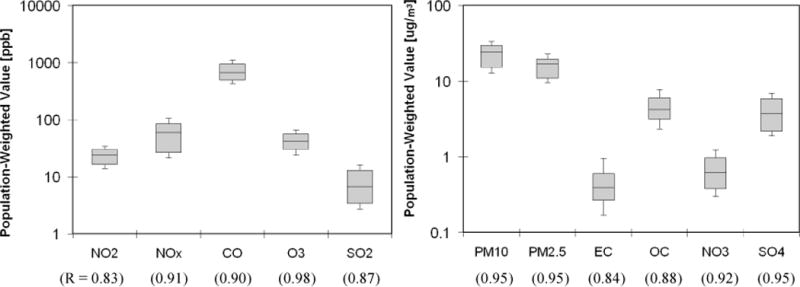
Box plots of the population-weighted pollutant values over the 1999–2004 study period. Dark lines indicate geometric means, shaded boxes indicate interquartile ranges, and extended lines with tails indicate standard deviations below and above the mean. R values with Jefferson Street monitor data are shown below axis.