
Figure 8.
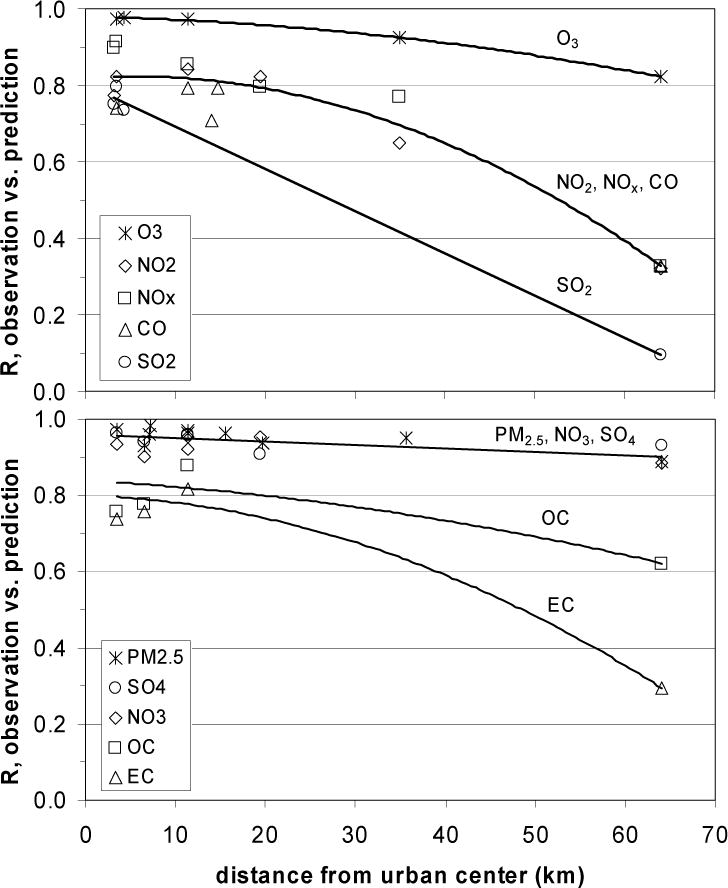
Correlation of monitor observations and model predictions without using data from that monitor as a function of distance from the urban center; top panel, pollutant gases; bottom panel, PM2.5 total and major component masses. Curves indicate spatial trends for single pollutants or groups of pollutants. For co-located monitoring sites, both sets of observations were removed for model prediction at those sites. In the case of SO2, observations at Stilesboro and Yorkville, located 63 and 64 km from the urban center respectively, were removed for prediction at this distance because the proximity of these two rural monitors (separated by 22 km) is atypical of rural monitors for other pollutants.