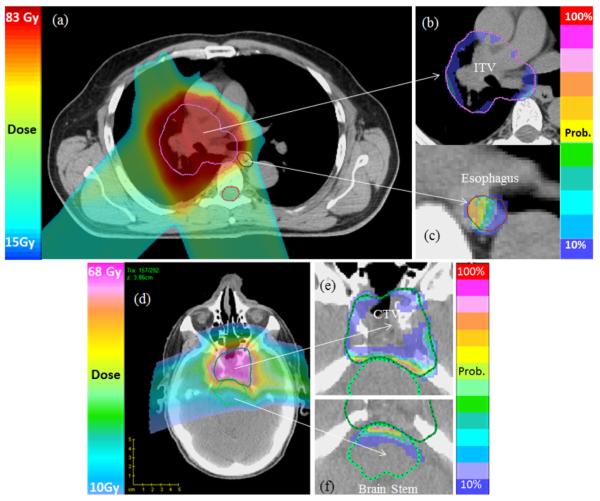
Fig. 6.
Probability map for selected cases. The nominal plan dose distributions for a lung and a brain cancer case are shown in (a) and (d). The probability of not receiving the prescribed dose to the internal target volume (ITV) or clinical target volume (CTV) because of uncertainties is shown in (b) and (e). The probability of exceeding the specified dose constraint on esophagus and brainstem is shown in (c) and (f).

