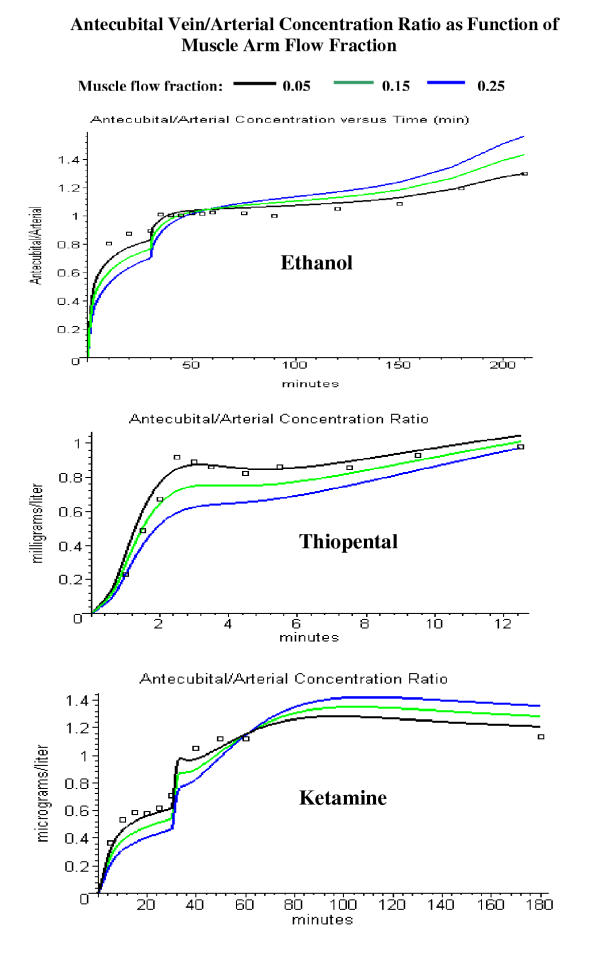
Figure 7.
Comparison of the PBPK model antecubital vein/arterial concentration ratio with the experimental data for different values of muscle flow fraction (frmuscle) for ethanol (top), thiopental (middle) and ketamine (bottom). The model ratio is shown for a fractional muscle flow contribution of 0.05 (black, the "standard" value, used in figs. 2, 3, 4, 5), 0.15 (green) and 0.25 (blue).

