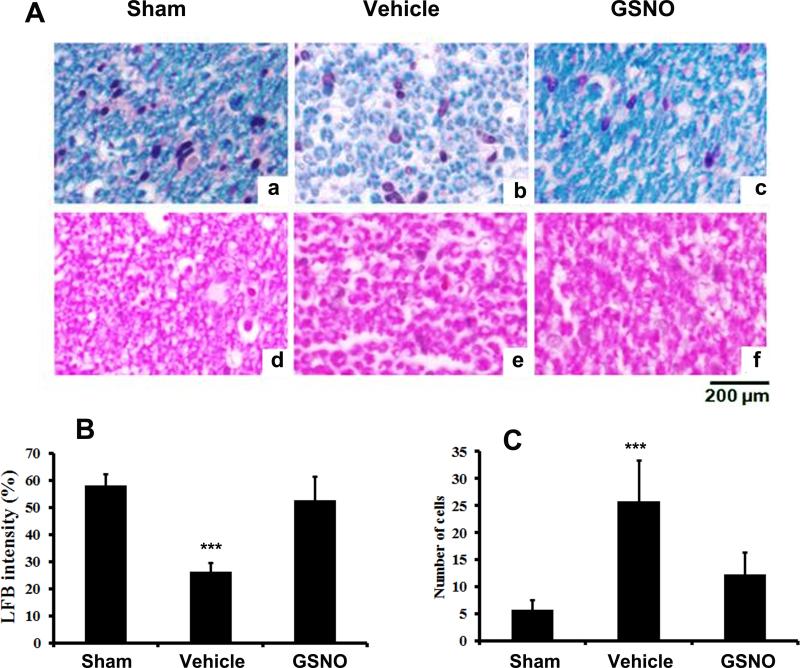
Fig 3.
Effect of GSNO on CEC-induced changes in LFB histochemistry (a-c) and cellular infiltration (d-f) of CE nerve fiber 14 days after CEC. Myelin level of the nerve fiber was significantly reduced in vehicle (b) when compared with sham (a) and GSNO (c) groups. Increased cellular infiltration was also observed in vehicle (e) compared with sham (d) and GSNO (f) rats. Photomicrographs are representative of n= 5 in each group. Histograms show the quantitative difference in LFB staining intensity and number of infiltrated cells of CE of different experimental groups. Vehicle group had significantly decreased level of LFB staining (B) and increased number of cellular infiltration (C)) compared with sham and GSNO animals. ***p>0.001vs. sham and GSNO.

