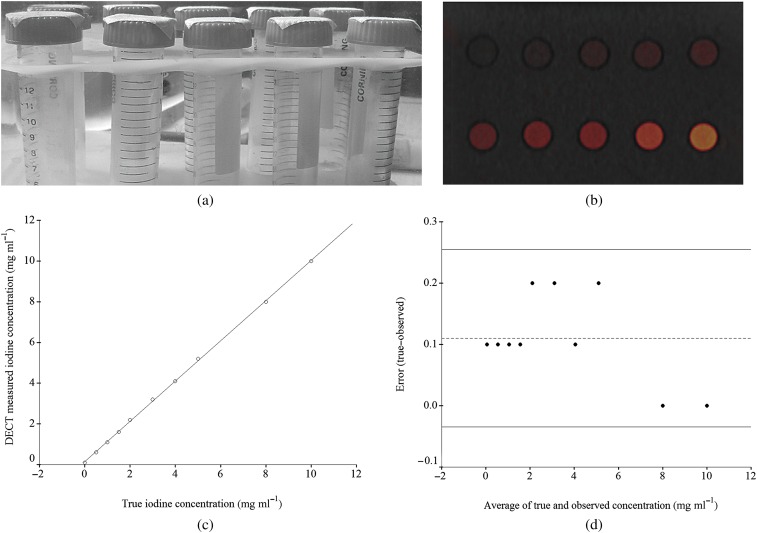
Figure 1.
Iodine phantom. (a) Photograph shows iodine phantom and test tubes consisting of 10 solutions of varying iodine concentration ranging from 0 to 10 mg I ml−1. (b) Axial dual-energy CT (DECT) iodine overlay image of the phantom with varying iodine concentration ranging from 0 to 10 mg I ml−1 produced by a three-material decomposition algorithm showing 80 kVp and 140 kVp greyscale information combined at a 50:50 ratio with iodine colour-encoded overlay. (c) Scatter plot reveals excellent correlation between the iodine concentration measured with DECT and the true iodine concentration in the phantom (r=0.999, p<0.0001). (d) Bland–Altman plot shows differences between true and observed iodine concentrations vs average of true and observed concentrations. The dashed line represents a mean error of 0.11 mg ml−1. The two solid lines represent the 25th–75th percentiles of the limits of agreement. The error in measured iodine concentration with DECT is less than the mean error for concentrations in the physiological range.

