
Figure 5.
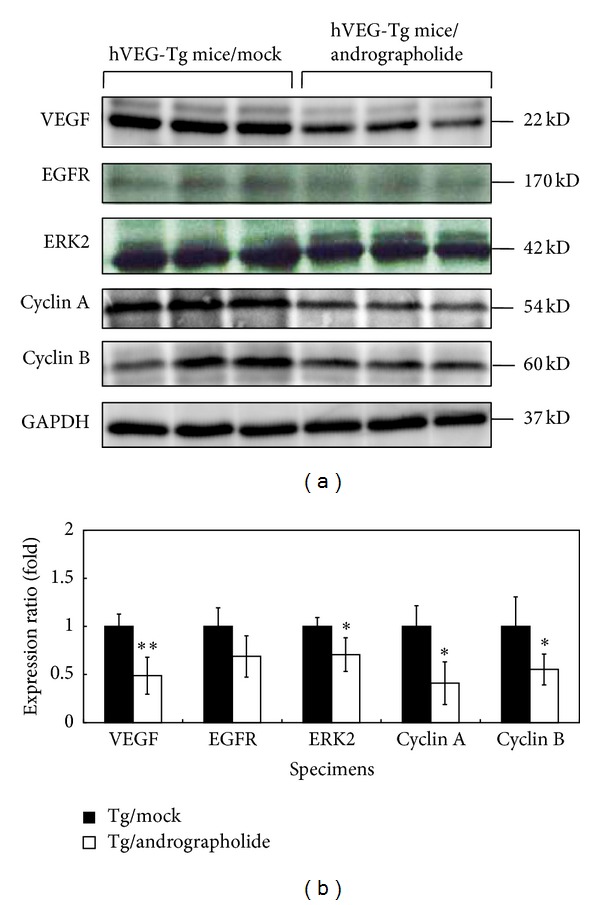
Western blot analysis of VEGF-A, EGFR, ERK2, Cyclin A, and Cyclin B protein in the lung tissues of the Tg and Tg/Andrographolide groups. GADPH was used as an internal control. Data are presented as the means ± SEM (n = 6). *P < 0.05 versus Tg group. **P < 0.01 versus Tg group.