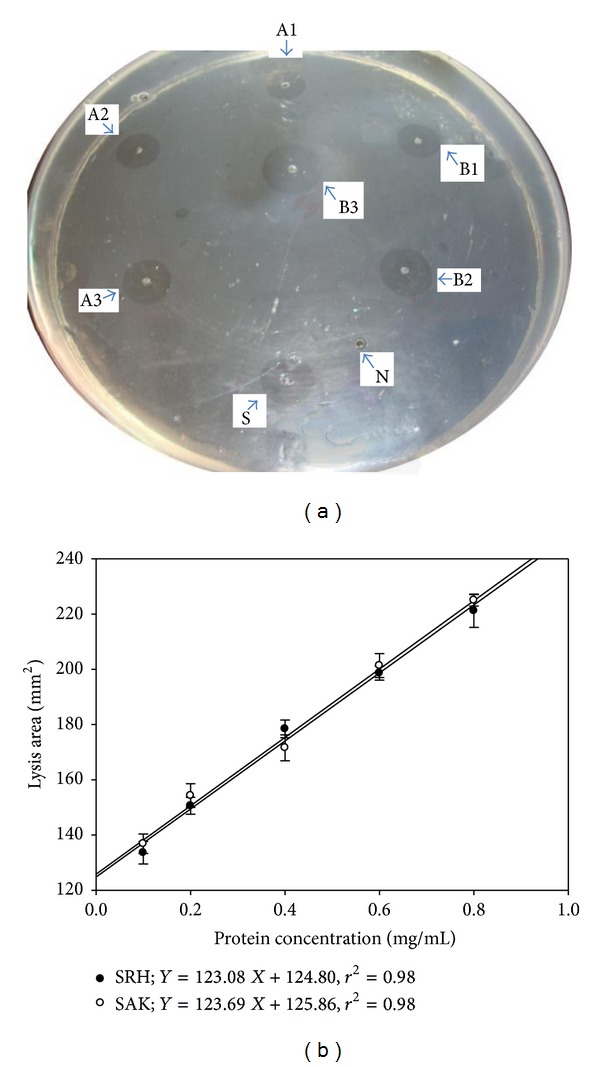
Figure 4.

Comparison of fibrinolytic activity of SRH and SAK. The fibrinolytic activity was monitored by incubating the fibrin plate containing different concentrations of SRH or SAK at 37°C for 6 h. (a) Results are representative of three independent experiments. The wells A1, A2, and A3 loaded with recombinant SAK while B1, B2, and B3 contain SRH. The well S represents the positive control with 2000 IU of streptokinase while N as a negative control with HBS. 20 μL samples of different concentrations (0.1, 0.2, and 0.4 mg/mL) were loaded into the wells of fibrin plate. The lytic areas are shown as clear zone. (b) Fibrinolytic regression curve of SRH and SAK. The areas of clear zones were plotted over the various concentration proteins. The data shown are mean of three independent experiments.
