
Figure 2.
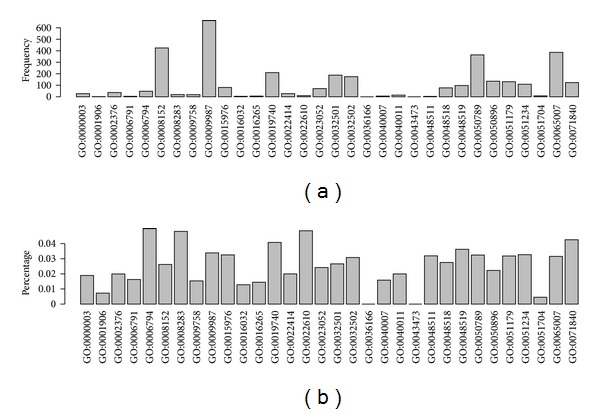
Illustrating the distribution of GO terms of biological process in the optimal feature set. (a) The frequency of GO terms of biological process. (b) The percentage of GO terms of biological process.
Official websites use .gov
A
.gov website belongs to an official
government organization in the United States.
Secure .gov websites use HTTPS
A lock (
) or https:// means you've safely
connected to the .gov website. Share sensitive
information only on official, secure websites.
Illustrating the distribution of GO terms of biological process in the optimal feature set. (a) The frequency of GO terms of biological process. (b) The percentage of GO terms of biological process.