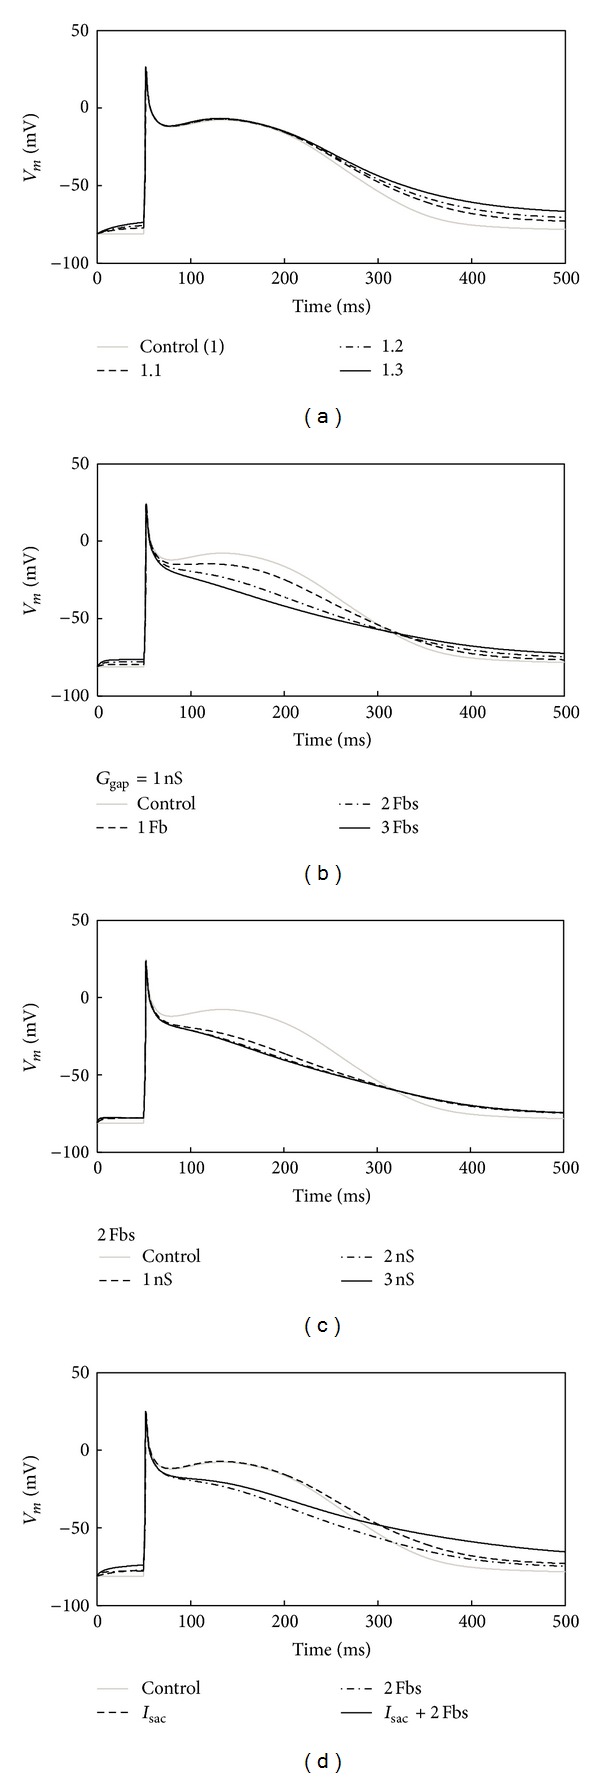
Figure 1.

Illustration of changes in the waveform of the atrial myocyte AP. (a) 1 myocyte coupled to I sac with a λ of 1.1 to 1.3. (b) 1 myocyte coupled to 1 to 3 Fbs with a G gap of 1 nS. (c) 1 myocyte coupled to 2 Fbs with a G gap of 1 to 3 nS. (d) 1 myocyte coupled to I sac or 2 Fbs or I sac and Fbs at the same time.
