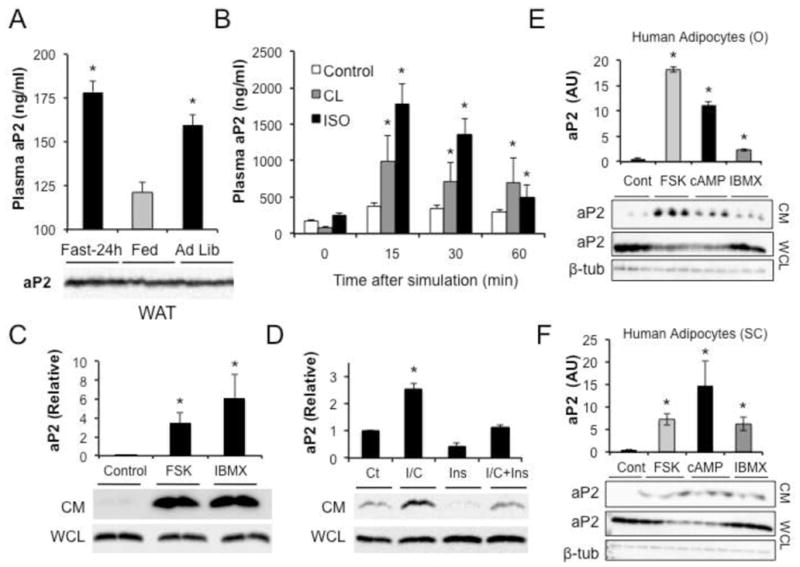
Figure 2. Nutritional status and lipolysis regulates aP2 secretion.

a, Plasma aP2 in mice fasted for 24 hours, refed for 4 hours after a 24-hour fast, or fed ad libitum. Below the graphs are corresponding aP2 western blots in WAT lysates. b, Plasma aP2 levels in mice injected with saline (Control), CL 316243 (CL, 0.1mg/kg) or isoproterenol (ISO, 1mg/kg) to induce lipolysis. At least 6 male mice were used in each experiment. c, aP2 in conditioned medium (CM) or whole cell lysates (WCL) of adipose tissue explants treated with forskolin (FSK, 20μM) or isobutylmethylxanthine (IBMX, 1mM). Below the graphs are corresponding aP2 western blots in CM and WCL. d, aP2 in CM or WCL of adipocytes treated with isobutylmethylxanthine and dibutryl cyclic adenosine monophosphate (IBMX/db-cAMP; I/C, 1mM) and insulin (Ins, 100ng/ml). Below the graphs are corresponding aP2 western blots in CM and WCL. e–f, aP2 in CM or WCL of primary human omental (O) or subcutaneous (SC) adipocytes treated with FSK, db-cAMP, or IBMX. Below the graphs are corresponding aP2 western blots in CM and WCL blotted with anti-aP2 antibody. Beta-tubulin is shown as a loading control. Data are presented as means ± SEM. * p < 0.05 in student’s t test.
