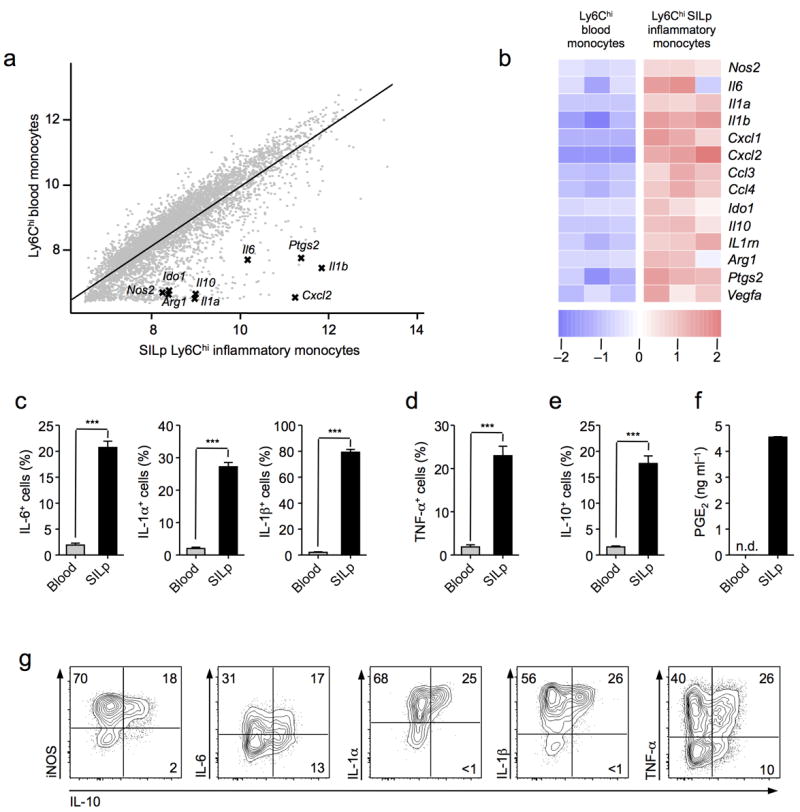
Figure 2. Ly6Chi inflammatory monocytes have dual features in the SILp.

(a) Comparison of microarray expression values in FACS sorted Ly6Chi inflammatory monocytes (CD115+CD11b+), and Ly6Chi small intestine lamina propria (SILp) monocytes (MHCIIhiCD11b+). Both populations were purified by FACS from T. gondii infected C57BL/6 mice at day 8 post infection.(b) Heat map representation of key pro-inflammatory and regulatory genes identified from the profiling in (a). Each column represents an individual biological replicate. (c,d,e) Intracellular cytokine staining for IL-6, IL-1α, IL-1β, TNF-α, and IL-10, in blood Ly6Chi monocytes or SILp Ly6Chi monocytes in whole tissue suspensions cultured for 3 hrs in the presence of brefeldin A. Cells were gated on the live Ly6ChiCD11bhiMHCIIhi population. (f) Enzyme immunoassay (EIA) for PGE2 in supernatants from FACS sorted Ly6Chi blood Mo, and Ly6Chi SILp monocytes in whole tissue suspensions after18 hrs culture. (g) Intracellular cytokine staining for IL-10 in conjunction with iNOS, IL-6, IL-1α, IL-1β, and TNF-α in SILp Ly6Chi monocytes cultured for 3 hr in the presence of brefeldin A. (a,b) Data are from one experiment with three biological replicates, each consisting of 1×10⁵ Ly6Chi blood monocytes, or Ly6ChiSILp monocytes (3–4 mice per replicate). (c-g) Data are representative of three independent experiments with three mice per group, results shown as mean ± SEM.Statistical comparisons were performed using the Student’s t test (***P<0.001).
