
Figure 5. Ly6Chi inflammatory monocytes regulate neutrophil activation via production of PGE2.
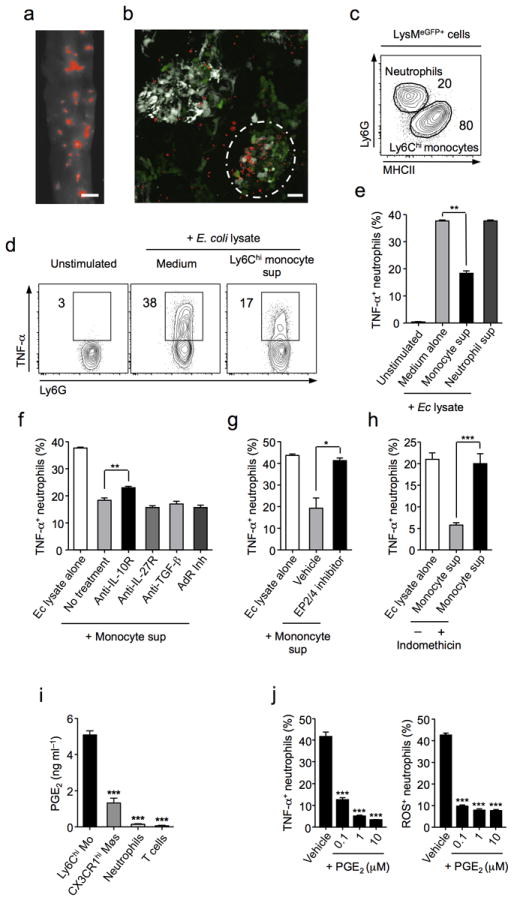
(a) Parasite localization visualized using RFP-expressing T. gondii in whole tissue mounts of jejunal sections from day 8 infection (Scale bar 2 mm). (b) Fixed jejunal tissue from day 8 infected CD11cYFPxLysMeGFP mice was whole mounted and sites of T. gondii invasion analysed by confocal microscopy (CD11c, white; LysM, Green; T. gondii, Red) (Scale bar 20 μm). Circle denotes foci of high parasite density. (c) Frequency of neutrophils (Ly6G+) and monocytes (MHCIIhi) within LysMeGFP population from T. gondii infected SILp. (d) Bone marrow neutrophils (Ly6G+CD11b+) were sorted by FACS and stimulated by E. coli lysate with Ly6Chi monocyte supernatant or control medium. Production of TNF-α was assessed by intracellular cytokine staining. (e) TNF-α production by neutrophils stimulated with E. coli lysate and treated with control medium, monocyte supernatant, or neutrophil supernatant. (f) Neutrophils were stimulated as in (d) and treated with Anti-IL-10R, Anti-IL-27R, Anti-TGF-β, or pan adenosine receptor (AdR) inhibitors in combination with monocyte supernatant and TNF-α production assessed. (g) Neutrophils were stimulated as in (d) and pre-treated with either inhibitors to the PGE2-receptors EP2 and EP4 or vehicle. (h) Neutrophils were stimulated as in (d) and treated with monocyte supernatants that were generated in the presence or absence of indomethacin and TNF-α production assessed. (i) SILp Ly6Chi monocytes, CX3CR1hi resident macrophages, neutrophils and T cells were sorted by FACS and cultured at equal concentration for 18 hrs. PGE2 was measured in triplicate supernatants by EIA. (j) Neutrophils were stimulated as in (d) and treated with increasing concentrations of purified PGE2. TNF-α production was assessed by flow cytometry. Additionally, neutrophils were treated with formyl-peptide, fMLP in the presence of increasing concentrations of purified PGE2. ROS production was assessed by flow cytometry. Histograms represent TNF-α production and ROS production ± SEM. Data are representative of three independent experiments, results are mean ± SEM. Statistical comparisons performed using the Student’s t test (*P<0.05, **P<0.01, ***P<0.001).